Operational Reality: Testing, Observability, and Failure in Distributed Systems
Most migrations succeed in a demo environment and fail in production. The reason is predictable: distributed systems do not fail like monoliths. They fail partially, they fail silently, and they fail in ways that look like “slow” rather than “down”. That is why distributed systems observability is now a board level capability, not an engineering nice to have.
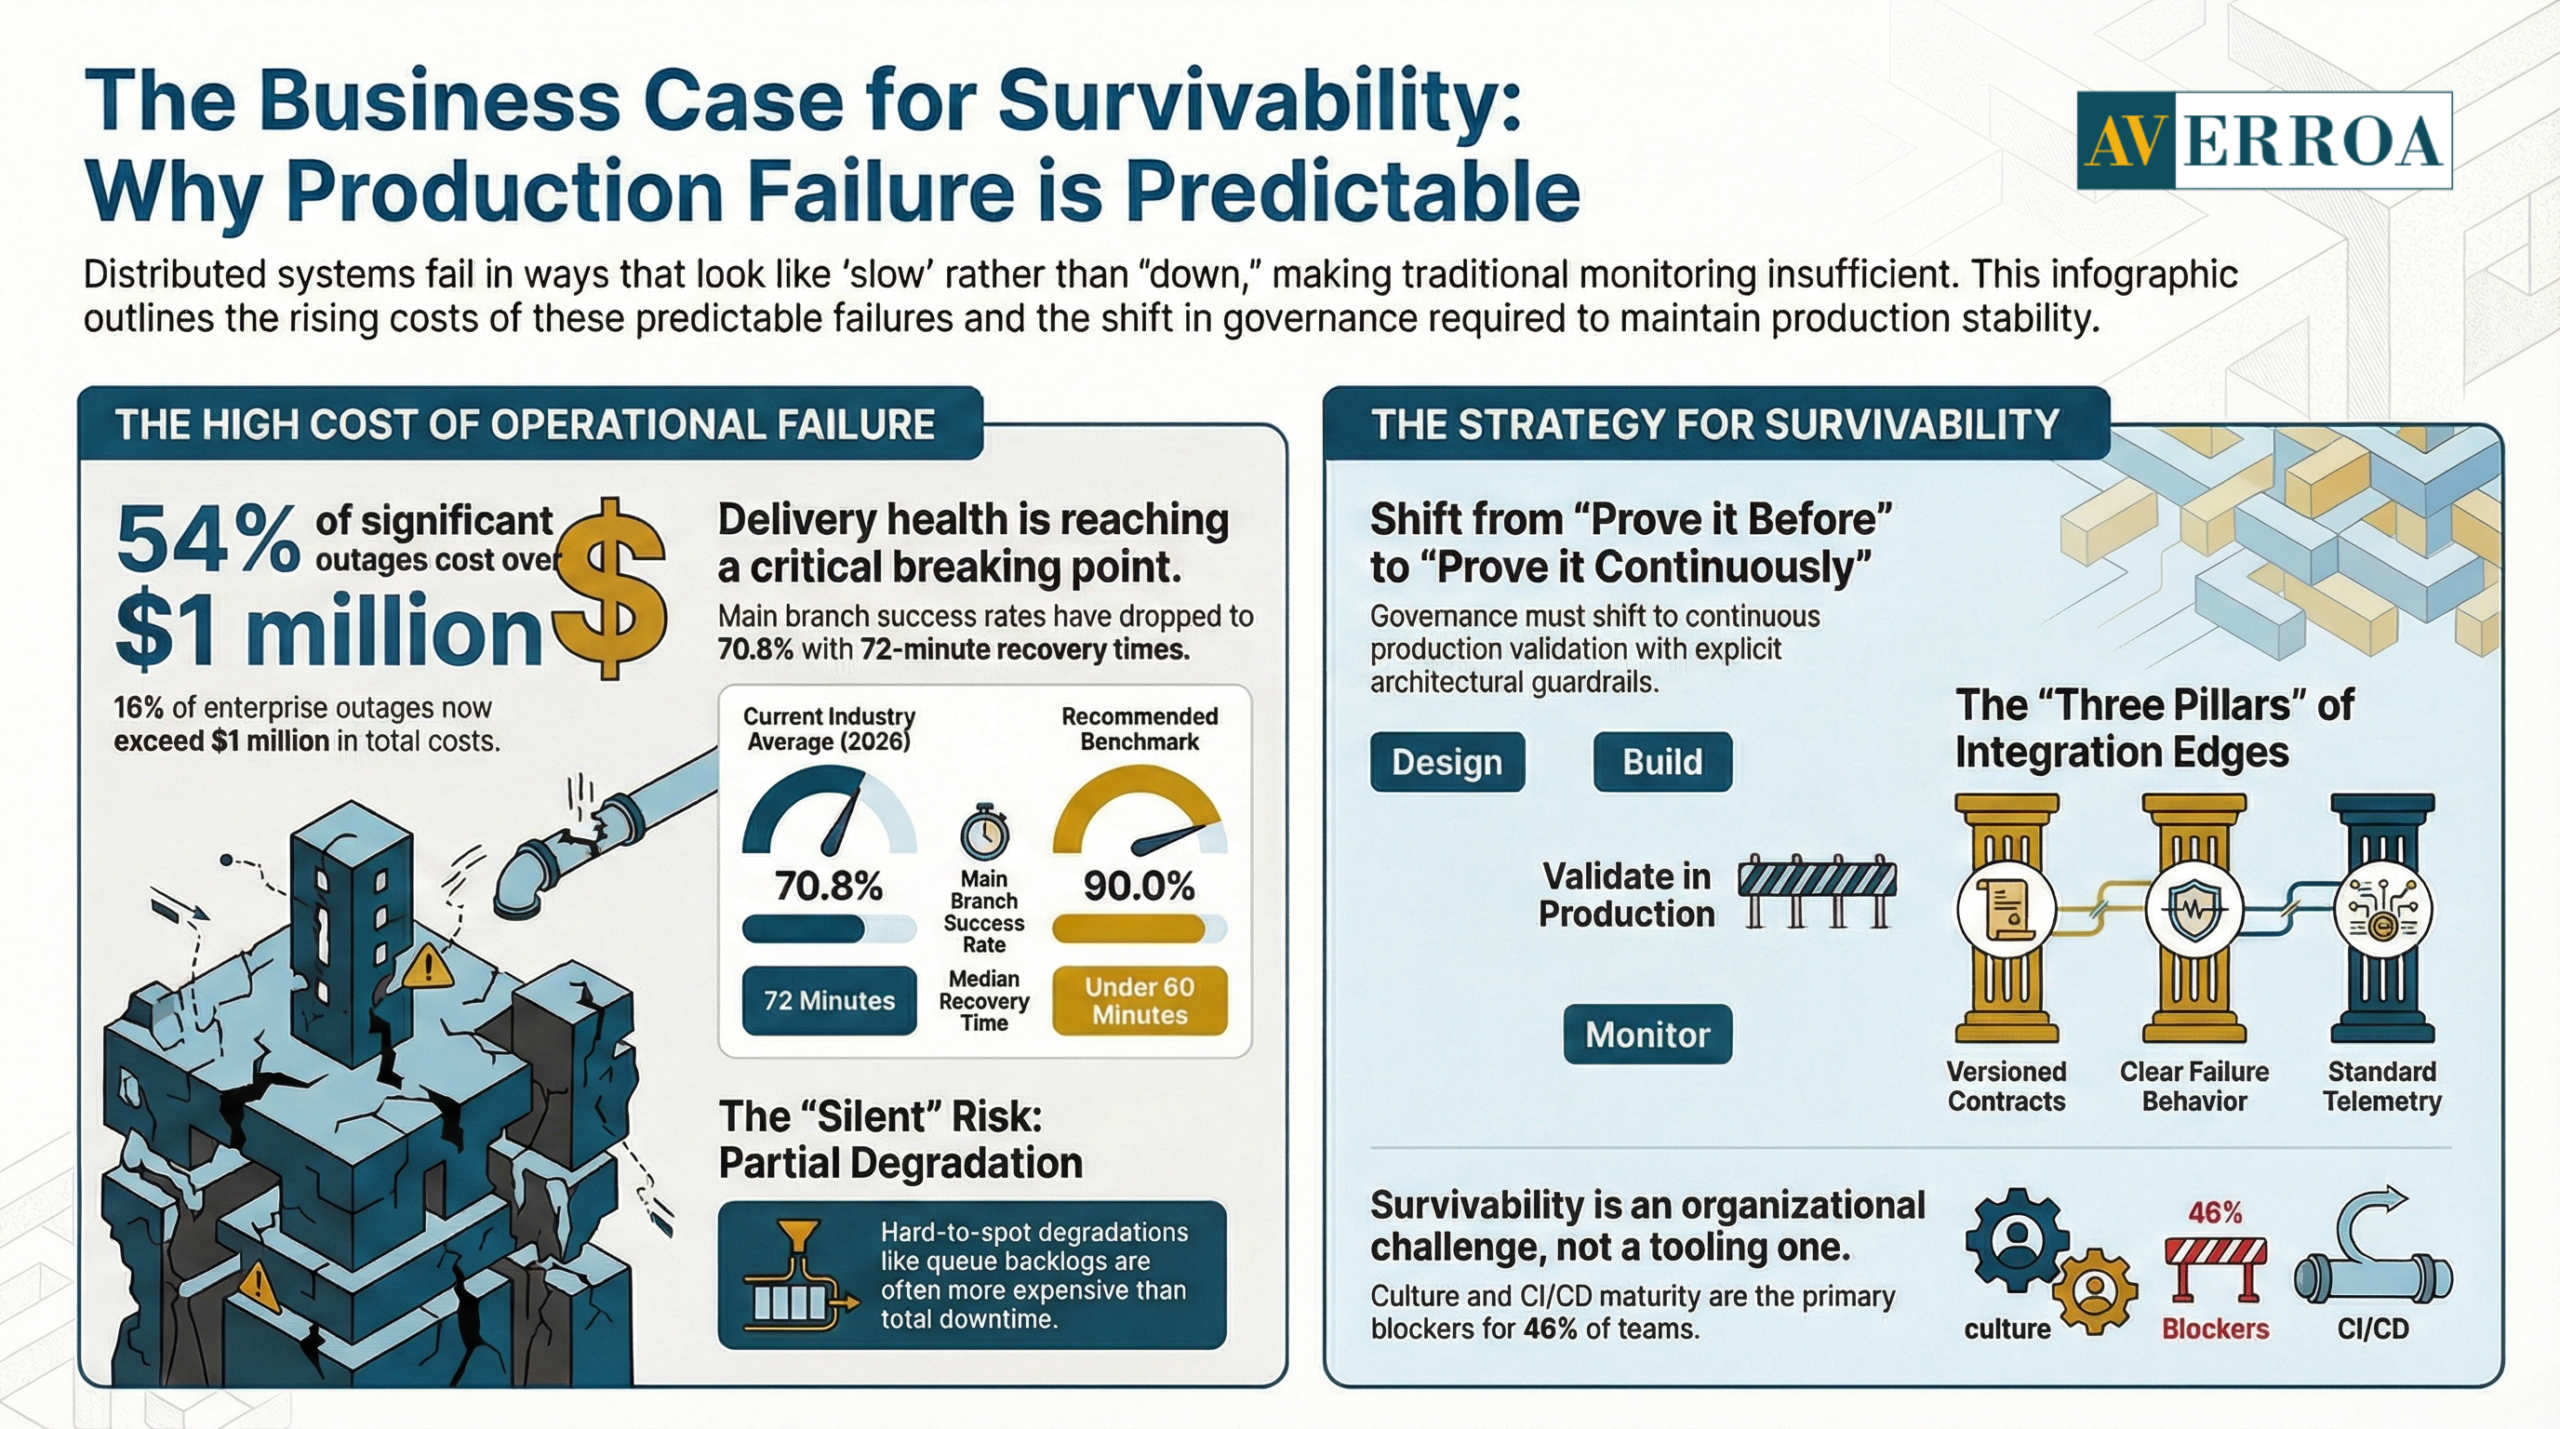
The economics are already clear. In Uptime Institute’s Annual Outage Analysis 2024 executive summary, more than half of respondents (54%) said their most recent significant outage cost more than $100,000, and 16% said it cost more than $1 million. (March 2024) (datacenter.uptimeinstitute.com) These are not edge cases. They are recurring failure modes.
At the same time, delivery volume is rising faster than validation capacity. CircleCI’s 2026 State of Software Delivery takeaways show main branch success rates dropped to 70.8%, and typical recovery times rose to 72 minutes. (Feb 18, 2026) (circleci.com) That combination is dangerous in a distributed estate: more change, more failure, slower recovery.
This article is a practical operating guide. It explains what changes when you move to distributed systems, how to test for survivability, how to implement distributed systems observability, and which resilience patterns keep production stable.
The business case for survivability, why production failure is predictable
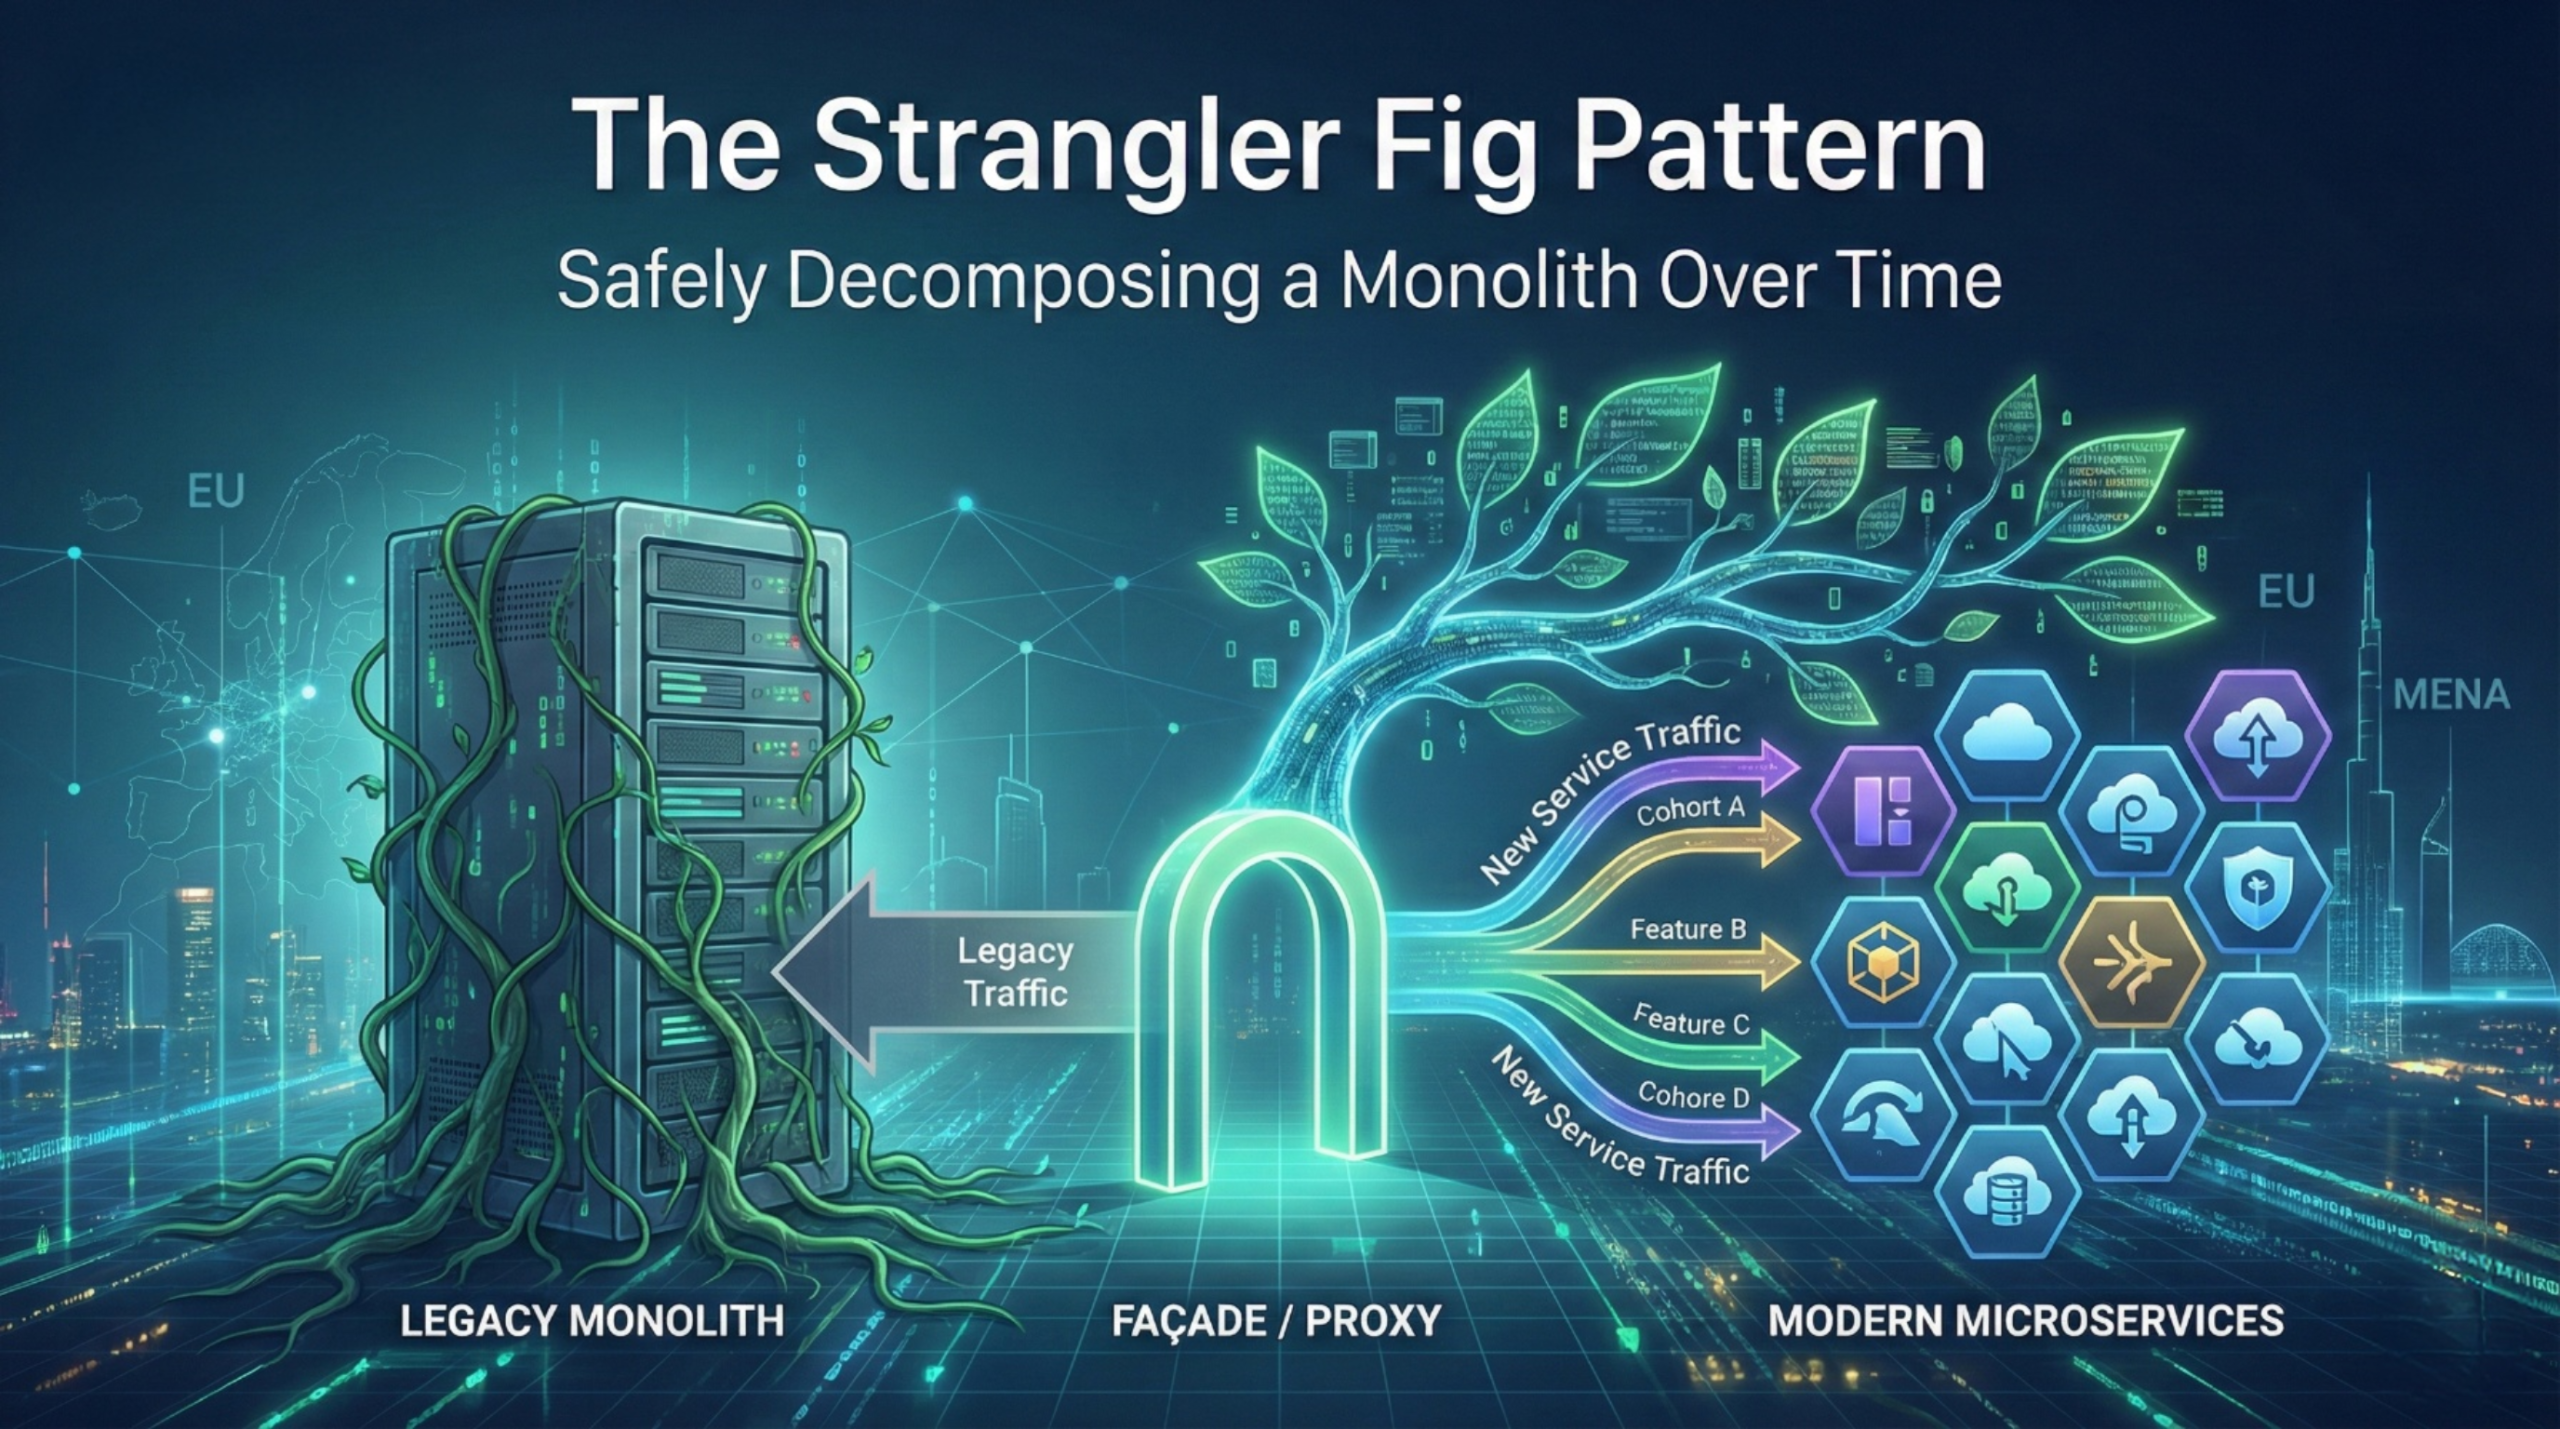
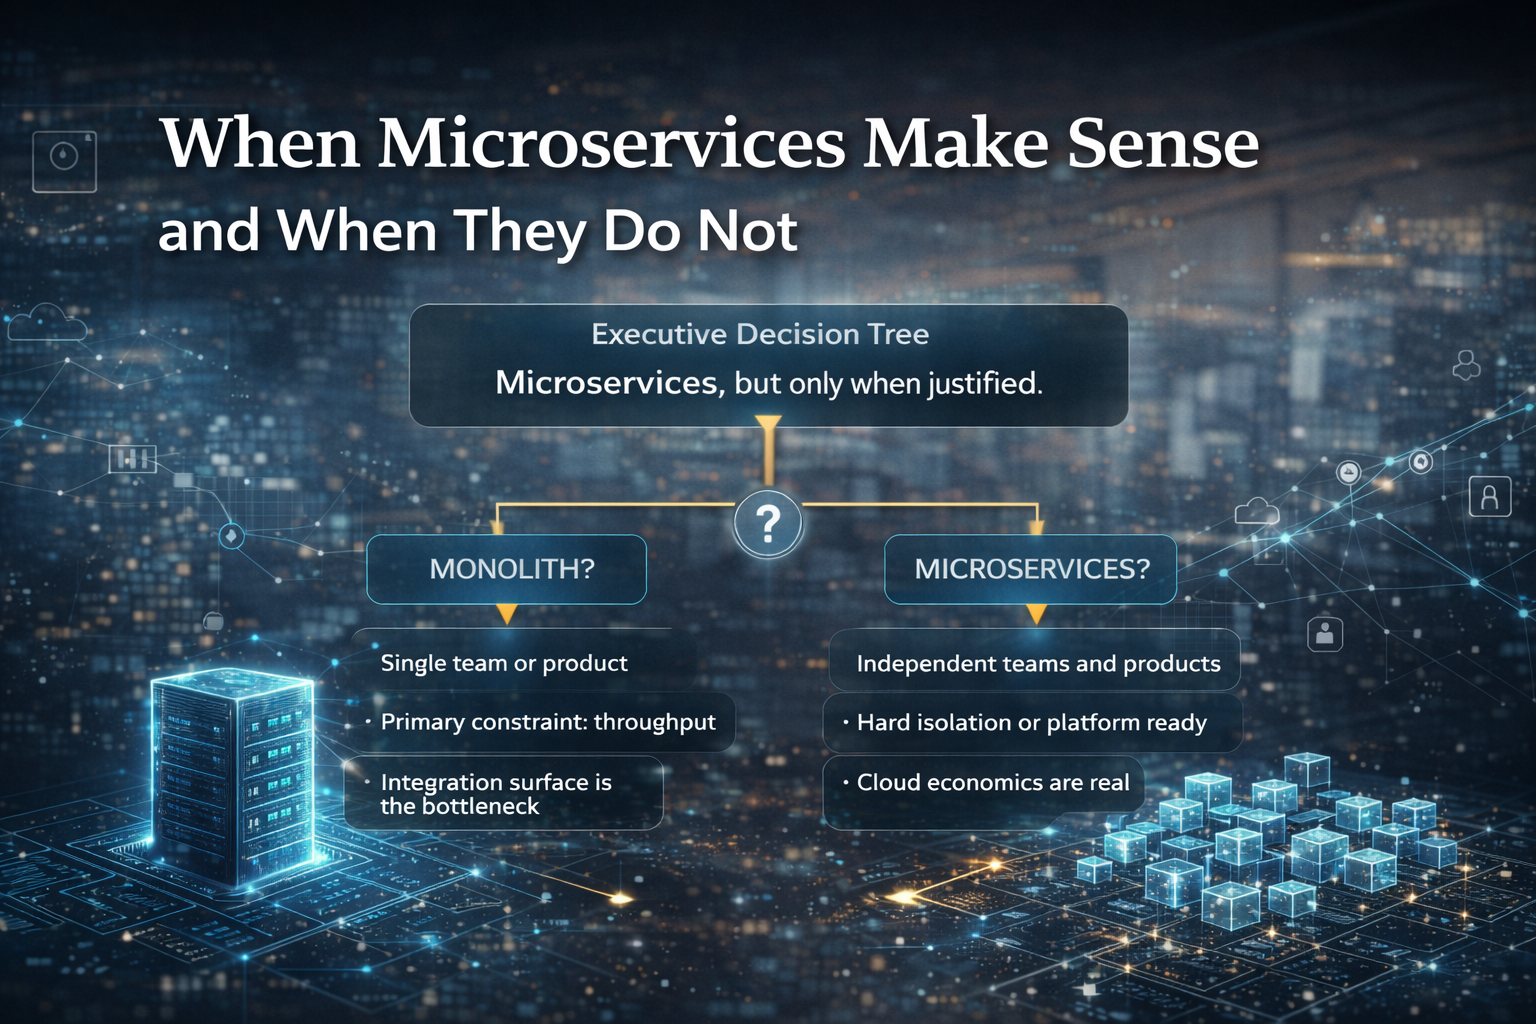
A distributed architecture is an explicit trade. You gain independent deployment and scaling. You also gain more failure surfaces: networks, queues, retries, timeouts, schema drift, identity propagation, and third party dependencies. The question for leaders is not “will we have failures”. The question is “how fast do we detect, isolate, and recover without customer harm”.
Business impact and risk
The cost distribution of outages is now meaningfully high. Uptime Institute reports that 54% of respondents said their most recent significant outage cost more than $100,000, and 16% said it cost more than $1 million. (March 2024) (datacenter.uptimeinstitute.com) The implication is straightforward: in many organisations, one badly managed incident can erase months of productivity gains from a migration.
In a distributed system, the most expensive incidents are often not total downtime. They are partial degradations: a payment confirmation path that occasionally times out, a workflow step that retries and duplicates actions, a queue that backlogs and creates delayed fulfilment. These incidents are harder to spot without distributed systems observability.
What changes in operating model and governance
Governance must shift from “prove it before production” to “prove it continuously in production”, with explicit guardrails. Two changes matter most:
- Ownership becomes end to end. Someone must own the customer journey across services, not just a single component.
- Release risk becomes measurable. You need standard deployment and incident KPIs, and leadership must use them to fund reliability work, not treat it as discretionary.
CNCF’s Annual Survey 2024 shows how often cultural and delivery maturity block progress. For container usage and deployment, nearly half (46%) cited cultural challenges with the development team, and 40% cited CI/CD challenges. (Apr 2025 publication) (cncf.io) The implication is that survivability is mostly organisational readiness, not tooling choice.
Architecture and integration implications
Distributed systems create more integration contracts and more “edges”. Every edge needs three things to survive production:
- a clear contract (API or event schema, versioned)
- clear failure behaviour (timeouts, retries, fallbacks, idempotency)
- standard telemetry (logs, metrics, traces) so failures are diagnosable
This is the foundation of distributed systems observability: making failure behaviour explicit and observable.
Testing in distributed systems: confidence is a pipeline, not a phase
Unit tests are necessary and insufficient. In a distributed system, the dominant failure modes live between services. That is why testing must move from “does my code work” to “does the system survive realistic failure”.
Why test strategy is now a business control
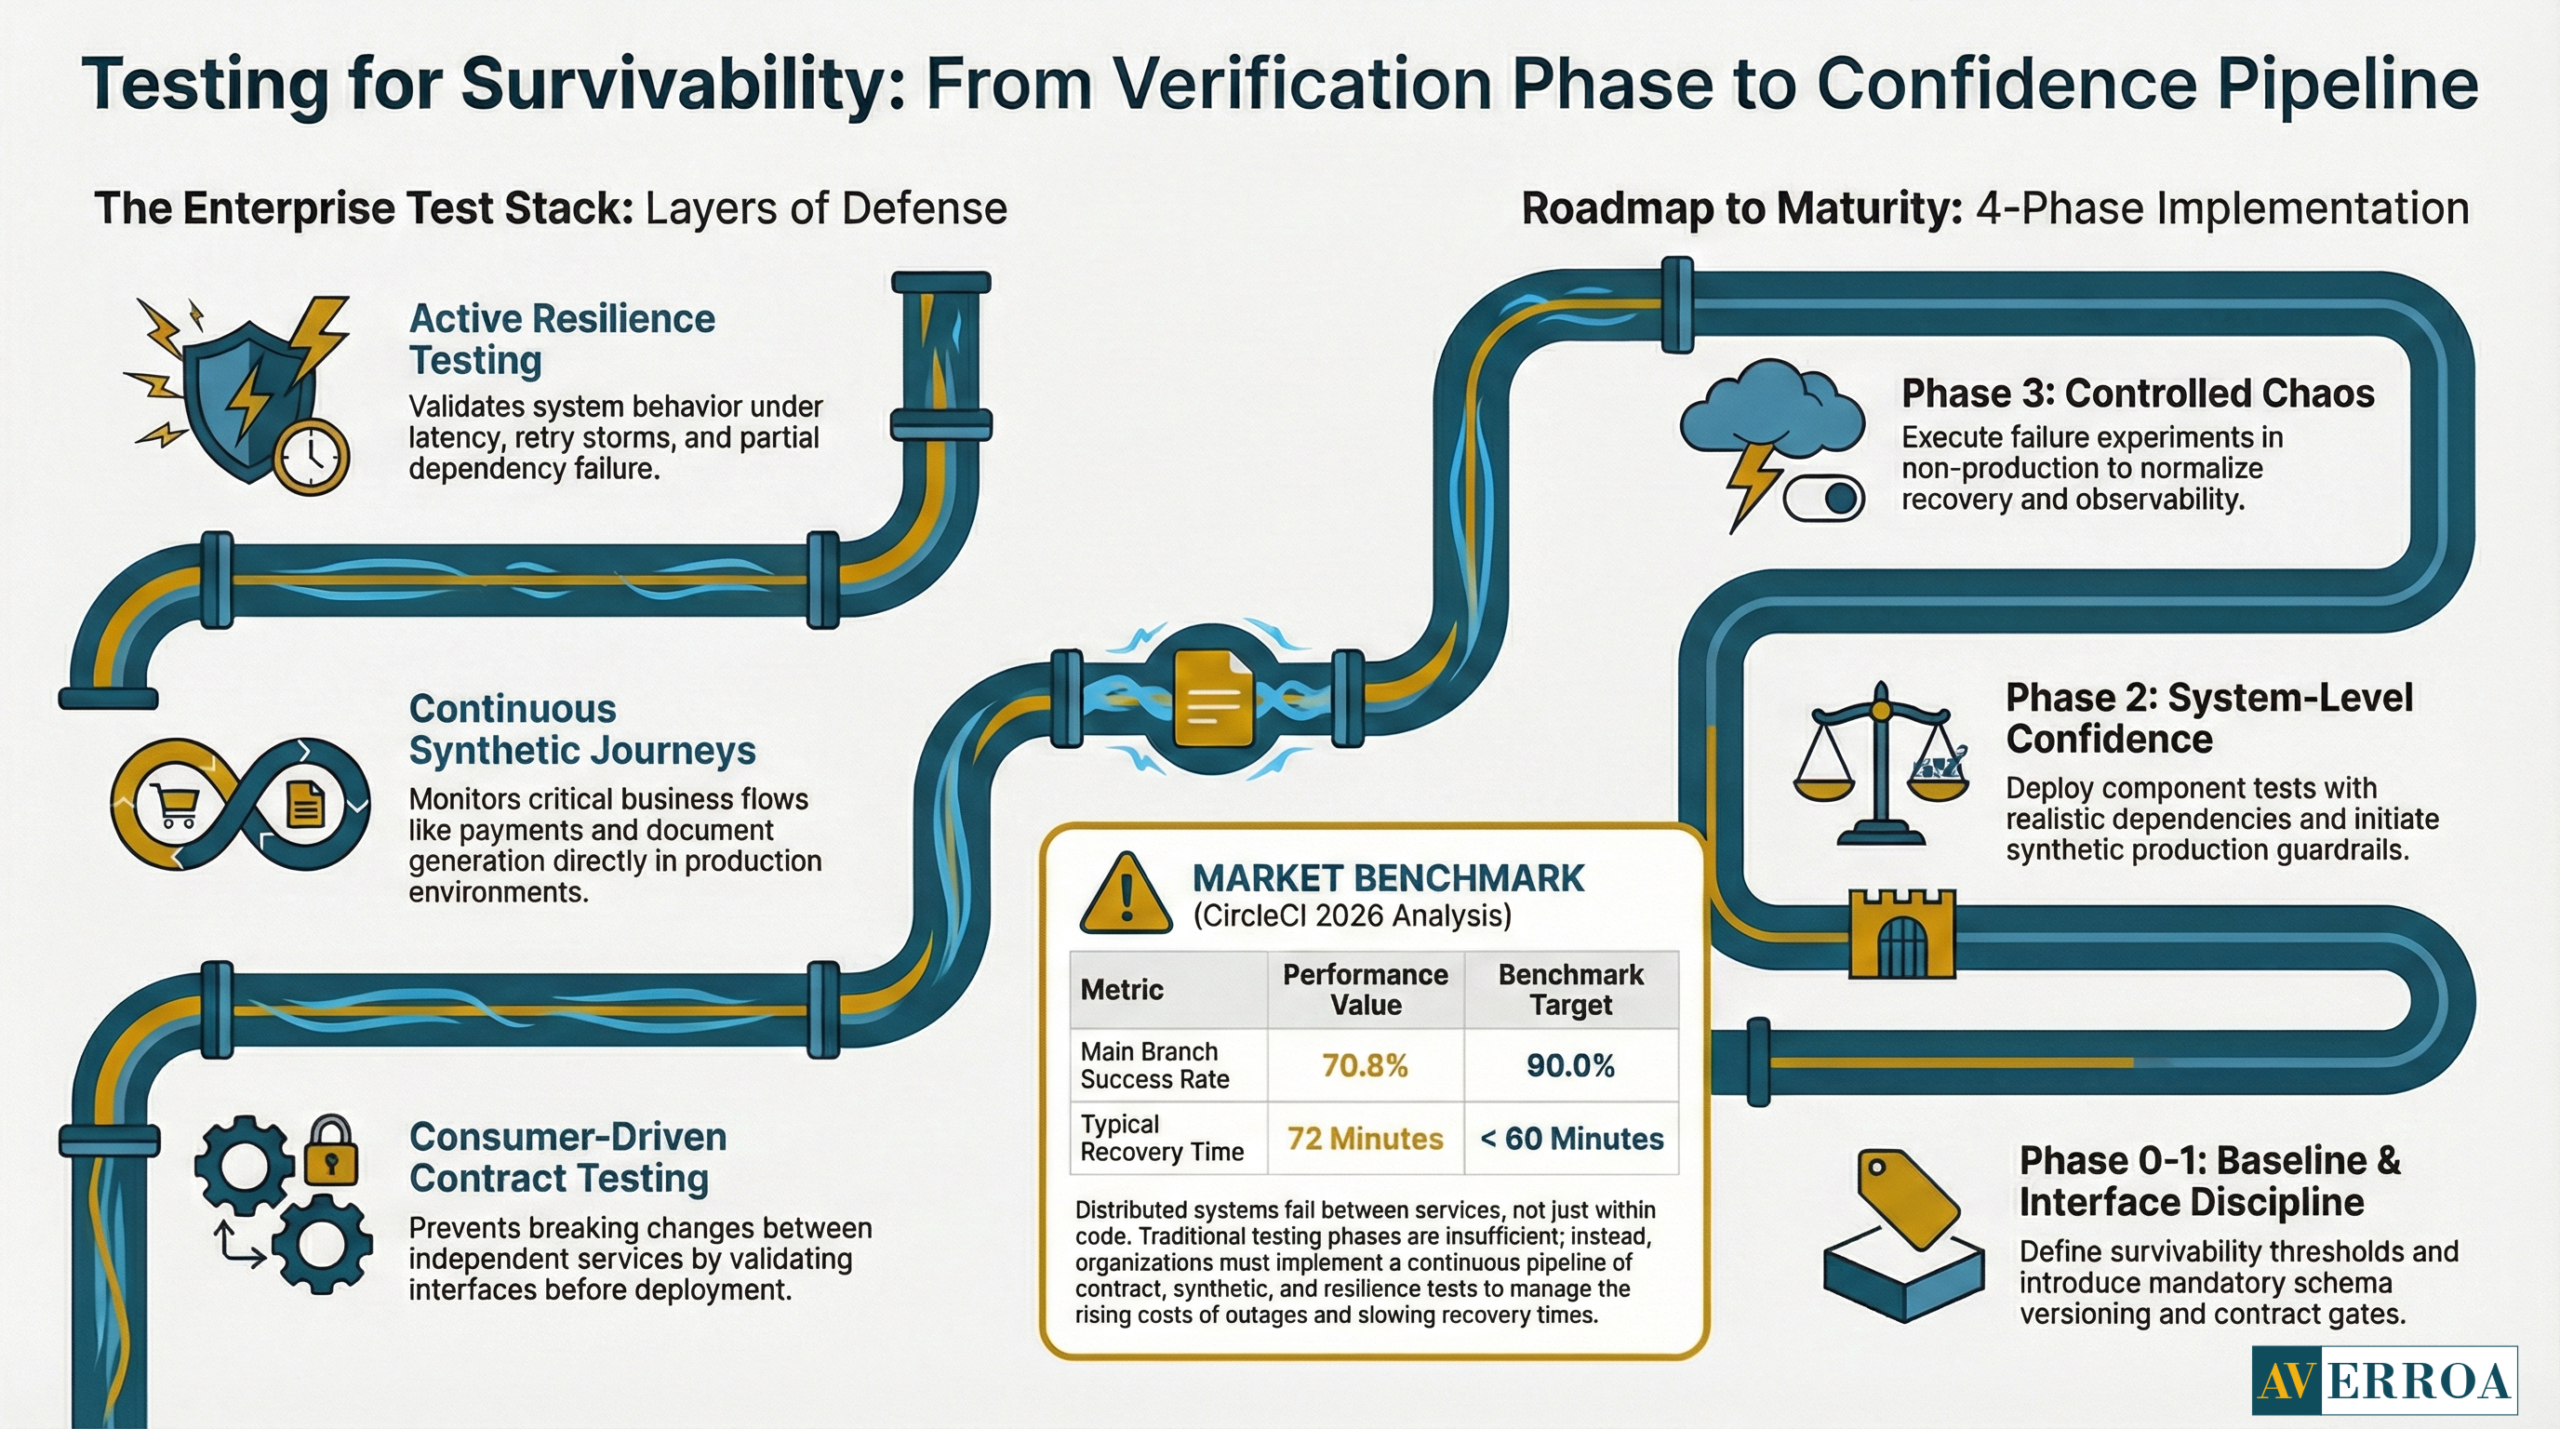
CircleCI’s 2026 analysis provides a concrete warning signal: main branch success rates dropped to 70.8%, well below their recommended benchmark of 90%, and recovery times climbed to 72 minutes. (Feb 18, 2026) (circleci.com) Even if you do not use CircleCI, the message generalises: validation and recovery are the constraints, not code generation or feature branching. In distributed environments, these constraints amplify. A failed deploy can break a chain of dependent services and create broad customer impact.
The practical test stack that survives production
A workable enterprise test stack typically includes:
- Contract tests for interfaces
Consumer driven contract testing catches breaking changes before deployment. It is the single most effective way to reduce cross team integration incidents when services evolve independently. - Component tests with realistic dependencies
Test a service with its local database, its queue, and its identity middleware. Stub only what you must. - Synthetic journeys in pre production and production
Run a few business critical flows continuously, for example “create case”, “approve workflow step”, “generate document”, “complete payment”. Synthetic monitoring becomes a production guardrail, and it feeds distributed systems observability - Resilience tests
Test timeout behaviour, retry storms, idempotency, and backpressure. Most distributed incidents are “retry plus timeouts plus queuing” failures.
Implementation approach: phases, guardrails, typical failure modes
Phase 0: Baseline survivability requirements
Define what must not fail, and what can degrade. Capture customer harm thresholds per journey.
Phase 1: Standardise interface discipline
Introduce contract tests, schema versioning, and deprecation rules.
Phase 2: Add system level confidence checks
Add synthetic journeys and component tests for critical services.
Phase 3: Make failure a first class test case
Add controlled chaos experiments in non production, and selectively in production once you have mature distributed systems observability.
Guardrails that prevent the common failures
- No retries without explicit timeouts.
- No writes without idempotency keys.
- No async processing without dead letter queues and replay tooling.
- No production route without telemetry parity across logs, metrics, and traces.
Typical failure modes
- “Green builds, red production”, because integration paths were not tested under latency and partial failure.
- Flaky tests that destroy trust in the pipeline, leading to bypass behaviour.
- Contracts that exist informally, causing breaking changes and emergency hotfixes.
Anonymised example: an EU B2B platform migrated a workflow engine into services. Unit tests were strong, but contract tests were absent. A minor field rename broke downstream document generation. The incident lasted hours because there was no trace correlation across services, and logs lacked consistent request IDs. The fix combined two changes: contract tests as a merge gate, and mandatory trace context propagation, which strengthened distributed systems observability immediately.
Distributed systems observability: logs, traces, and metrics that reduce MTTR
Observability is not monitoring. Monitoring tells you something is wrong. Observability tells you why, where, and what changed. In distributed systems, that difference is the difference between a 15 minute rollback and a 6 hour escalation chain.
Evidence: what the market is standardising on
Grafana’s Observability Survey Report 2025 states that 67% of organisations use Prometheus in production in some capacity, and OpenTelemetry has 41% production usage. (Mar 2025) (grafana.com) This matters for leaders because it signals convergence on standard telemetry primitives. You do not need exotic tooling. You need consistent implementation.
The minimum observability standard for production survivability
For distributed systems observability, insist on these minimums:
- Structured logs with correlation IDs
Every inbound request carries a request ID. Every downstream call propagates it. Logs are structured, not free text. - Traces across service boundaries
Tracing is the fastest way to find latency inflation and partial failures. It also reveals which dependency is actually on the critical path. - Golden metrics per service
Latency, traffic, errors, saturation. Keep dashboards simple and consistent across teams. - SLOs and error budgets
SLOs translate reliability into governance. A service that burns error budget too fast triggers a change freeze or a reliability sprint. Google’s SRE guidance illustrates the core arithmetic: if availability objective is 99.9%, the error budget is 0.1%. (Jun 22, 2020) (google.com)
Security and audit implications
A distributed system increases the number of logs, the number of identities, and the number of places that sensitive data can leak. In EU contexts, audit readiness often depends on being able to reconstruct “who did what, when” across multiple systems. That requires consistent log formats, consistent user identity propagation, and standard retention policies. This is another reason distributed systems observability must be a programme stream, not a team preference.
Anonymised example: a MENA public sector service introduced asynchronous processing to improve responsiveness. The service survived load, but citizen support volume rose because status updates were inconsistent between channels. Observability showed that an event consumer lagged under load, and retries caused duplicate status events. The remediation was operational: introduce consumer lag SLOs, implement idempotency keys, and add a “status projection health” dashboard visible to operations leadership. This is distributed systems observability acting as a control system, not just as a troubleshooting tool.
Failure patterns and resilience: how to stop small incidents becoming outages
Distributed systems are failure prone by design because networks fail. The winning strategy is to engineer failure containment so that one failing dependency does not take the entire system down.
Resilience patterns that consistently work
- Timeouts and budgets
Every call has a timeout. Budgets ensure the total path time stays within customer expectations. - Circuit breakers
Stop calling a failing dependency, fail fast, and recover gradually. This prevents retry storms. - Bulkheads
Isolate resources so one hot path cannot starve the entire service. - Backpressure and queue discipline
Queues need max lengths, dead letter handling, and replay tooling. Without this, “eventual” becomes “never”. - Load shedding and rate limiting
Protect core functions by shedding non critical work under pressure.
These patterns only work when instrumented. This links directly back to distributed systems observability: resilience without telemetry is faith, not engineering.
Implementation approach: operational phases and governance guardrails
Phase 0: Define survivability KPIs and incident model
Set targets for MTTD, MTTR, change failure rate, and SLO attainment. Define escalation playbooks.
Phase 1: Instrument the estate and standardise
Adopt standard logging, tracing, dashboards, alerting rules. Confirm that every critical journey is traceable.
Phase 2: Introduce resilience patterns as templates
Provide approved libraries and patterns so teams do not reinvent. Enforce policy gates in CI/CD.
Phase 3: Run game days and failure drills
Simulate dependency failures, latency spikes, and queue backlogs. Capture lessons and update runbooks.
Typical pitfalls
- Over alerting, leading to alert fatigue and slow response.
- Retries without idempotency, causing duplicate actions, especially in workflow automation.
- “Shadow dependencies”, where a service depends on an internal call chain that no one owns end to end.
- Observability gaps that only appear during major incidents.
KPIs and value realisation
To measure operational value, track these KPIs consistently:
- Change failure rate, and rollback frequency.
- MTTR, plus “time to isolate” as a separate metric.
- SLO compliance for critical journeys.
- Incident recurrence rate by root cause category.
- Pipeline health, including main branch success rates, because this predicts production stability.
CircleCI’s 2024 report provides an older benchmark signal: throughput up 11% across all branches and 68% on production branches, with median recovery from errors under 60 minutes. (2024) (circleci.com) The implication is that organisations can move these metrics, but only when validation and recovery are treated as core engineering outcomes.
Actionable Takeaways
- Treat distributed systems observability as a programme deliverable, with standards, coverage targets, and owners.
- Use contract testing as the primary defence against breaking changes between services.
- Require correlation IDs and trace propagation for every production route, otherwise MTTR will rise as the system distributes.
- Build resilience patterns into templates, timeouts, circuit breakers, bulkheads, backpressure, and rate limiting.
- Measure success with incident metrics and SLOs, not with service count or cloud spend alone.
- Use game days to test failure behaviour and runbooks, then iterate based on evidence.
- Fix CI/CD bottlenecks in mainline validation, because weak success rates predict production instability. (circleci.com)
- Align operating model to ownership: one accountable owner for each end to end journey, especially in workflow automation.
- Fund cultural and delivery maturity explicitly, because survey evidence shows these are common blockers. (cncf.io)
If you are modernising workflow heavy enterprise systems and need a practical plan for testing, telemetry standards, and production resilience, start with Enterprise Custom Development.
References
- Uptime Institute, Annual Outage Analysis 2024 executive summary, outage cost statistics. (March 2024)
https://datacenter.uptimeinstitute.com/rs/711-RIA-145/images/2024.Resiliency.Survey.ExecSum.pdf - CNCF, Cloud Native 2024 Annual Survey report, container deployment challenges including culture and CI/CD. (Apr 1, 2025)
https://www.cncf.io/wp-content/uploads/2025/04/cncf_annual_survey24_031225a.pdf - CircleCI, The 2024 State of Software Delivery report PDF, throughput and recovery metrics. (2024)
https://circleci.com/landing-pages/assets/CircleCI-The-2024-State-of-Software-Delivery.pdf - CircleCI, 2026 State of Software Delivery takeaways, main branch success rate and recovery time. (Feb 18, 2026)
https://circleci.com/blog/five-takeaways-2026-software-delivery-report/ - Grafana Labs, Observability Survey Report 2025, Prometheus and OpenTelemetry adoption. (2025, published Mar 2025)
https://grafana.com/observability-survey/2025/ - Google Cloud, SRE error budgets and maintenance windows, error budget example. (Jun 22, 2020) https://cloud.google.com/blog/products/management-tools/sre-error-budgets-and-maintenance-windows
Operational Reality: Testing, Observability, and Failure in Distributed Systems
Most migrations succeed in a demo environment and fail in production. The reason is predictable: distributed systems do not fail like monoliths. They fail partially, they fail silently, and they fail in ways that look like “slow” rather than “down”. That is why distributed systems observability is now a board level capability, not an engineering nice to have.
The economics are already clear. In Uptime Institute’s Annual Outage Analysis 2024 executive summary, more than half of respondents (54%) said their most recent significant outage cost more than $100,000, and 16% said it cost more than $1 million. (March 2024) (datacenter.uptimeinstitute.com) These are not edge cases. They are recurring failure modes.
At the same time, delivery volume is rising faster than validation capacity. CircleCI’s 2026 State of Software Delivery takeaways show main branch success rates dropped to 70.8%, and typical recovery times rose to 72 minutes. (Feb 18, 2026) (circleci.com) That combination is dangerous in a distributed estate: more change, more failure, slower recovery.
This article is a practical operating guide. It explains what changes when you move to distributed systems, how to test for survivability, how to implement distributed systems observability, and which resilience patterns keep production stable.
The business case for survivability, why production failure is predictable
A distributed architecture is an explicit trade. You gain independent deployment and scaling. You also gain more failure surfaces: networks, queues, retries, timeouts, schema drift, identity propagation, and third party dependencies. The question for leaders is not “will we have failures”. The question is “how fast do we detect, isolate, and recover without customer harm”.
Business impact and risk
The cost distribution of outages is now meaningfully high. Uptime Institute reports that 54% of respondents said their most recent significant outage cost more than $100,000, and 16% said it cost more than $1 million. (March 2024) (datacenter.uptimeinstitute.com) The implication is straightforward: in many organisations, one badly managed incident can erase months of productivity gains from a migration.
In a distributed system, the most expensive incidents are often not total downtime. They are partial degradations: a payment confirmation path that occasionally times out, a workflow step that retries and duplicates actions, a queue that backlogs and creates delayed fulfilment. These incidents are harder to spot without distributed systems observability.
What changes in operating model and governance
Governance must shift from “prove it before production” to “prove it continuously in production”, with explicit guardrails. Two changes matter most:
- Ownership becomes end to end. Someone must own the customer journey across services, not just a single component.
- Release risk becomes measurable. You need standard deployment and incident KPIs, and leadership must use them to fund reliability work, not treat it as discretionary.
CNCF’s Annual Survey 2024 shows how often cultural and delivery maturity block progress. For container usage and deployment, nearly half (46%) cited cultural challenges with the development team, and 40% cited CI/CD challenges. (Apr 2025 publication) (cncf.io) The implication is that survivability is mostly organisational readiness, not tooling choice.
Architecture and integration implications
Distributed systems create more integration contracts and more “edges”. Every edge needs three things to survive production:
- a clear contract (API or event schema, versioned)
- clear failure behaviour (timeouts, retries, fallbacks, idempotency)
- standard telemetry (logs, metrics, traces) so failures are diagnosable
This is the foundation of distributed systems observability: making failure behaviour explicit and observable.
Testing in distributed systems: confidence is a pipeline, not a phase
Unit tests are necessary and insufficient. In a distributed system, the dominant failure modes live between services. That is why testing must move from “does my code work” to “does the system survive realistic failure”.
Why test strategy is now a business control
CircleCI’s 2026 analysis provides a concrete warning signal: main branch success rates dropped to 70.8%, well below their recommended benchmark of 90%, and recovery times climbed to 72 minutes. (Feb 18, 2026) (circleci.com) Even if you do not use CircleCI, the message generalises: validation and recovery are the constraints, not code generation or feature branching. In distributed environments, these constraints amplify. A failed deploy can break a chain of dependent services and create broad customer impact.
The practical test stack that survives production
A workable enterprise test stack typically includes:
- Contract tests for interfaces
Consumer driven contract testing catches breaking changes before deployment. It is the single most effective way to reduce cross team integration incidents when services evolve independently. - Component tests with realistic dependencies
Test a service with its local database, its queue, and its identity middleware. Stub only what you must. - Synthetic journeys in pre production and production
Run a few business critical flows continuously, for example “create case”, “approve workflow step”, “generate document”, “complete payment”. Synthetic monitoring becomes a production guardrail, and it feeds distributed systems observability - Resilience tests
Test timeout behaviour, retry storms, idempotency, and backpressure. Most distributed incidents are “retry plus timeouts plus queuing” failures.
Implementation approach: phases, guardrails, typical failure modes
Phase 0: Baseline survivability requirements
Define what must not fail, and what can degrade. Capture customer harm thresholds per journey.
Phase 1: Standardise interface discipline
Introduce contract tests, schema versioning, and deprecation rules.
Phase 2: Add system level confidence checks
Add synthetic journeys and component tests for critical services.
Phase 3: Make failure a first class test case
Add controlled chaos experiments in non production, and selectively in production once you have mature distributed systems observability.
Guardrails that prevent the common failures
- No retries without explicit timeouts.
- No writes without idempotency keys.
- No async processing without dead letter queues and replay tooling.
- No production route without telemetry parity across logs, metrics, and traces.
Typical failure modes
- “Green builds, red production”, because integration paths were not tested under latency and partial failure.
- Flaky tests that destroy trust in the pipeline, leading to bypass behaviour.
- Contracts that exist informally, causing breaking changes and emergency hotfixes.
Anonymised example: an EU B2B platform migrated a workflow engine into services. Unit tests were strong, but contract tests were absent. A minor field rename broke downstream document generation. The incident lasted hours because there was no trace correlation across services, and logs lacked consistent request IDs. The fix combined two changes: contract tests as a merge gate, and mandatory trace context propagation, which strengthened distributed systems observability immediately.
Distributed systems observability: logs, traces, and metrics that reduce MTTR
Observability is not monitoring. Monitoring tells you something is wrong. Observability tells you why, where, and what changed. In distributed systems, that difference is the difference between a 15 minute rollback and a 6 hour escalation chain.
Evidence: what the market is standardising on
Grafana’s Observability Survey Report 2025 states that 67% of organisations use Prometheus in production in some capacity, and OpenTelemetry has 41% production usage. (Mar 2025) (grafana.com) This matters for leaders because it signals convergence on standard telemetry primitives. You do not need exotic tooling. You need consistent implementation.
The minimum observability standard for production survivability
For distributed systems observability, insist on these minimums:
- Structured logs with correlation IDs
Every inbound request carries a request ID. Every downstream call propagates it. Logs are structured, not free text. - Traces across service boundaries
Tracing is the fastest way to find latency inflation and partial failures. It also reveals which dependency is actually on the critical path. - Golden metrics per service
Latency, traffic, errors, saturation. Keep dashboards simple and consistent across teams. - SLOs and error budgets
SLOs translate reliability into governance. A service that burns error budget too fast triggers a change freeze or a reliability sprint. Google’s SRE guidance illustrates the core arithmetic: if availability objective is 99.9%, the error budget is 0.1%. (Jun 22, 2020) (google.com)
Security and audit implications
A distributed system increases the number of logs, the number of identities, and the number of places that sensitive data can leak. In EU contexts, audit readiness often depends on being able to reconstruct “who did what, when” across multiple systems. That requires consistent log formats, consistent user identity propagation, and standard retention policies. This is another reason distributed systems observability must be a programme stream, not a team preference.
Anonymised example: a MENA public sector service introduced asynchronous processing to improve responsiveness. The service survived load, but citizen support volume rose because status updates were inconsistent between channels. Observability showed that an event consumer lagged under load, and retries caused duplicate status events. The remediation was operational: introduce consumer lag SLOs, implement idempotency keys, and add a “status projection health” dashboard visible to operations leadership. This is distributed systems observability acting as a control system, not just as a troubleshooting tool.
Failure patterns and resilience: how to stop small incidents becoming outages
Distributed systems are failure prone by design because networks fail. The winning strategy is to engineer failure containment so that one failing dependency does not take the entire system down.
Resilience patterns that consistently work
- Timeouts and budgets
Every call has a timeout. Budgets ensure the total path time stays within customer expectations. - Circuit breakers
Stop calling a failing dependency, fail fast, and recover gradually. This prevents retry storms. - Bulkheads
Isolate resources so one hot path cannot starve the entire service. - Backpressure and queue discipline
Queues need max lengths, dead letter handling, and replay tooling. Without this, “eventual” becomes “never”. - Load shedding and rate limiting
Protect core functions by shedding non critical work under pressure.
These patterns only work when instrumented. This links directly back to distributed systems observability: resilience without telemetry is faith, not engineering.
Implementation approach: operational phases and governance guardrails
Phase 0: Define survivability KPIs and incident model
Set targets for MTTD, MTTR, change failure rate, and SLO attainment. Define escalation playbooks.
Phase 1: Instrument the estate and standardise
Adopt standard logging, tracing, dashboards, alerting rules. Confirm that every critical journey is traceable.
Phase 2: Introduce resilience patterns as templates
Provide approved libraries and patterns so teams do not reinvent. Enforce policy gates in CI/CD.
Phase 3: Run game days and failure drills
Simulate dependency failures, latency spikes, and queue backlogs. Capture lessons and update runbooks.
Typical pitfalls
- Over alerting, leading to alert fatigue and slow response.
- Retries without idempotency, causing duplicate actions, especially in workflow automation.
- “Shadow dependencies”, where a service depends on an internal call chain that no one owns end to end.
- Observability gaps that only appear during major incidents.
KPIs and value realisation
To measure operational value, track these KPIs consistently:
- Change failure rate, and rollback frequency.
- MTTR, plus “time to isolate” as a separate metric.
- SLO compliance for critical journeys.
- Incident recurrence rate by root cause category.
- Pipeline health, including main branch success rates, because this predicts production stability.
CircleCI’s 2024 report provides an older benchmark signal: throughput up 11% across all branches and 68% on production branches, with median recovery from errors under 60 minutes. (2024) (circleci.com) The implication is that organisations can move these metrics, but only when validation and recovery are treated as core engineering outcomes.
Actionable Takeaways
- Treat distributed systems observability as a programme deliverable, with standards, coverage targets, and owners.
- Use contract testing as the primary defence against breaking changes between services.
- Require correlation IDs and trace propagation for every production route, otherwise MTTR will rise as the system distributes.
- Build resilience patterns into templates, timeouts, circuit breakers, bulkheads, backpressure, and rate limiting.
- Measure success with incident metrics and SLOs, not with service count or cloud spend alone.
- Use game days to test failure behaviour and runbooks, then iterate based on evidence.
- Fix CI/CD bottlenecks in mainline validation, because weak success rates predict production instability. (circleci.com)
- Align operating model to ownership: one accountable owner for each end to end journey, especially in workflow automation.
- Fund cultural and delivery maturity explicitly, because survey evidence shows these are common blockers. (cncf.io)
If you are modernising workflow heavy enterprise systems and need a practical plan for testing, telemetry standards, and production resilience, start with Enterprise Custom Development.
References
- Uptime Institute, Annual Outage Analysis 2024 executive summary, outage cost statistics. (March 2024)
https://datacenter.uptimeinstitute.com/rs/711-RIA-145/images/2024.Resiliency.Survey.ExecSum.pdf - CNCF, Cloud Native 2024 Annual Survey report, container deployment challenges including culture and CI/CD. (Apr 1, 2025)
https://www.cncf.io/wp-content/uploads/2025/04/cncf_annual_survey24_031225a.pdf - CircleCI, The 2024 State of Software Delivery report PDF, throughput and recovery metrics. (2024)
https://circleci.com/landing-pages/assets/CircleCI-The-2024-State-of-Software-Delivery.pdf - CircleCI, 2026 State of Software Delivery takeaways, main branch success rate and recovery time. (Feb 18, 2026)
https://circleci.com/blog/five-takeaways-2026-software-delivery-report/ - Grafana Labs, Observability Survey Report 2025, Prometheus and OpenTelemetry adoption. (2025, published Mar 2025)
https://grafana.com/observability-survey/2025/ - Google Cloud, SRE error budgets and maintenance windows, error budget example. (Jun 22, 2020) https://cloud.google.com/blog/products/management-tools/sre-error-budgets-and-maintenance-windows
Meet The Author
Meet The Author

Senior software engineer focused on backend systems and Android apps, delivering scalable web/mobile/cloud solutions. Leads technical direction, mentors teams, and ships high-performance services using ASP.NET Core/C#, microservices, and cloud-native infrastructure.
Senior software engineer focused on backend systems and Android apps, delivering scalable web/mobile/cloud solutions. Leads technical direction, mentors teams, and ships high-performance services using ASP.NET Core/C#, microservices, and cloud-native infrastructure.
Averroa Principal