The Hidden Cost Curve: Performance, Cloud Spend, and Microservices Economics
Microservices economics is where many enterprise migrations either earn trust or lose it. The architecture may be “modern”, but the bill, the latency, and the on call load often move in the wrong direction first. That is not a surprise. It is the default outcome when you increase the number of deployable units, duplicate data, add telemetry, and run legacy and new in parallel.
The timing is unforgiving. Flexera’s 2025 State of the Cloud press release found 84% of respondents say managing cloud spend is the top cloud challenge, and cloud spend is expected to rise 28% in the coming year. (19 Mar 2025) That same release notes budgets already exceed limits by 17%, and 33% of organisations spend more than $12M annually on public cloud. (19 Mar 2025)
At the same time, the FinOps Foundation’s State of FinOps Report 2025 reflects an uncomfortable maturity gap. It reports 861 respondents representing about $69B in public cloud spend, yet only 15% of practices are making optimisations based on cost. (2025)
So the decision is not whether microservices are “better”. The decision is whether you can manage the cost curve deliberately, using FinOps thinking and engineering guardrails, instead of discovering your new operating model through surprise invoices and production incidents.
Microservices economics: why costs rise before they fall
A strong opinion, based on repeated delivery patterns: microservices are not cheaper by default. They are a premium operating model. You pay for optionality, independent scaling, and faster change, and you only recover that investment if you control execution.
Business impact and risk
Cost is not just a finance topic. It is an operational risk indicator. When spend rises without clear value, teams cut corners, tooling sprawl grows, and production risk increases.
The cloud spend signals are already clear. Flexera reports budgets exceeding limits by 17% and cloud spend expected to increase 28%. (19 Mar 2025) In the same State of the Cloud key findings page, Flexera states organisations are focusing on cost optimisation to recapture 27% of cloud spend that continues to be wasted. (2025) If you increase architectural complexity without a disciplined value realisation plan, you often increase that waste surface.
What changes in the operating model and governance
Microservices economics changes who needs to care about cost and when. In a monolith, cost can be treated as a platform line item. In microservices, cost needs to be owned at service and journey level, by the teams making architecture choices.
The FinOps Foundation’s definition captures the operating model shift: FinOps is an operational framework and cultural practice that maximises business value, enables timely data driven decisions, and creates financial accountability through collaboration between engineering, finance, and business teams. (Updated Jan 2025)
If that collaboration does not exist, you get a governance gap. Engineering optimises for speed. Finance reacts after the invoice arrives. The cost curve becomes a surprise, not a managed programme.
Architecture and integration implications
Microservices increase cost drivers through:
- more runtime components, including gateways, service discovery, policy, telemetry pipelines
- more environments, because teams need independence and safe releases
- more cross service calls, which increases compute and latency overhead
- more data movement and duplication, which increases storage and processing costs
You can still win on unit economics, but only if you set up cost attribution and constraints early.
Where the money goes: performance tax, platform tax, people tax
To manage microservices economics, you need a clear view of where costs accumulate. The best programmes treat this as a portfolio of known taxes.
Performance tax, network, sidecars, and the “observability bill”
Distributed systems add overhead. Sometimes it is small. Sometimes it is material.
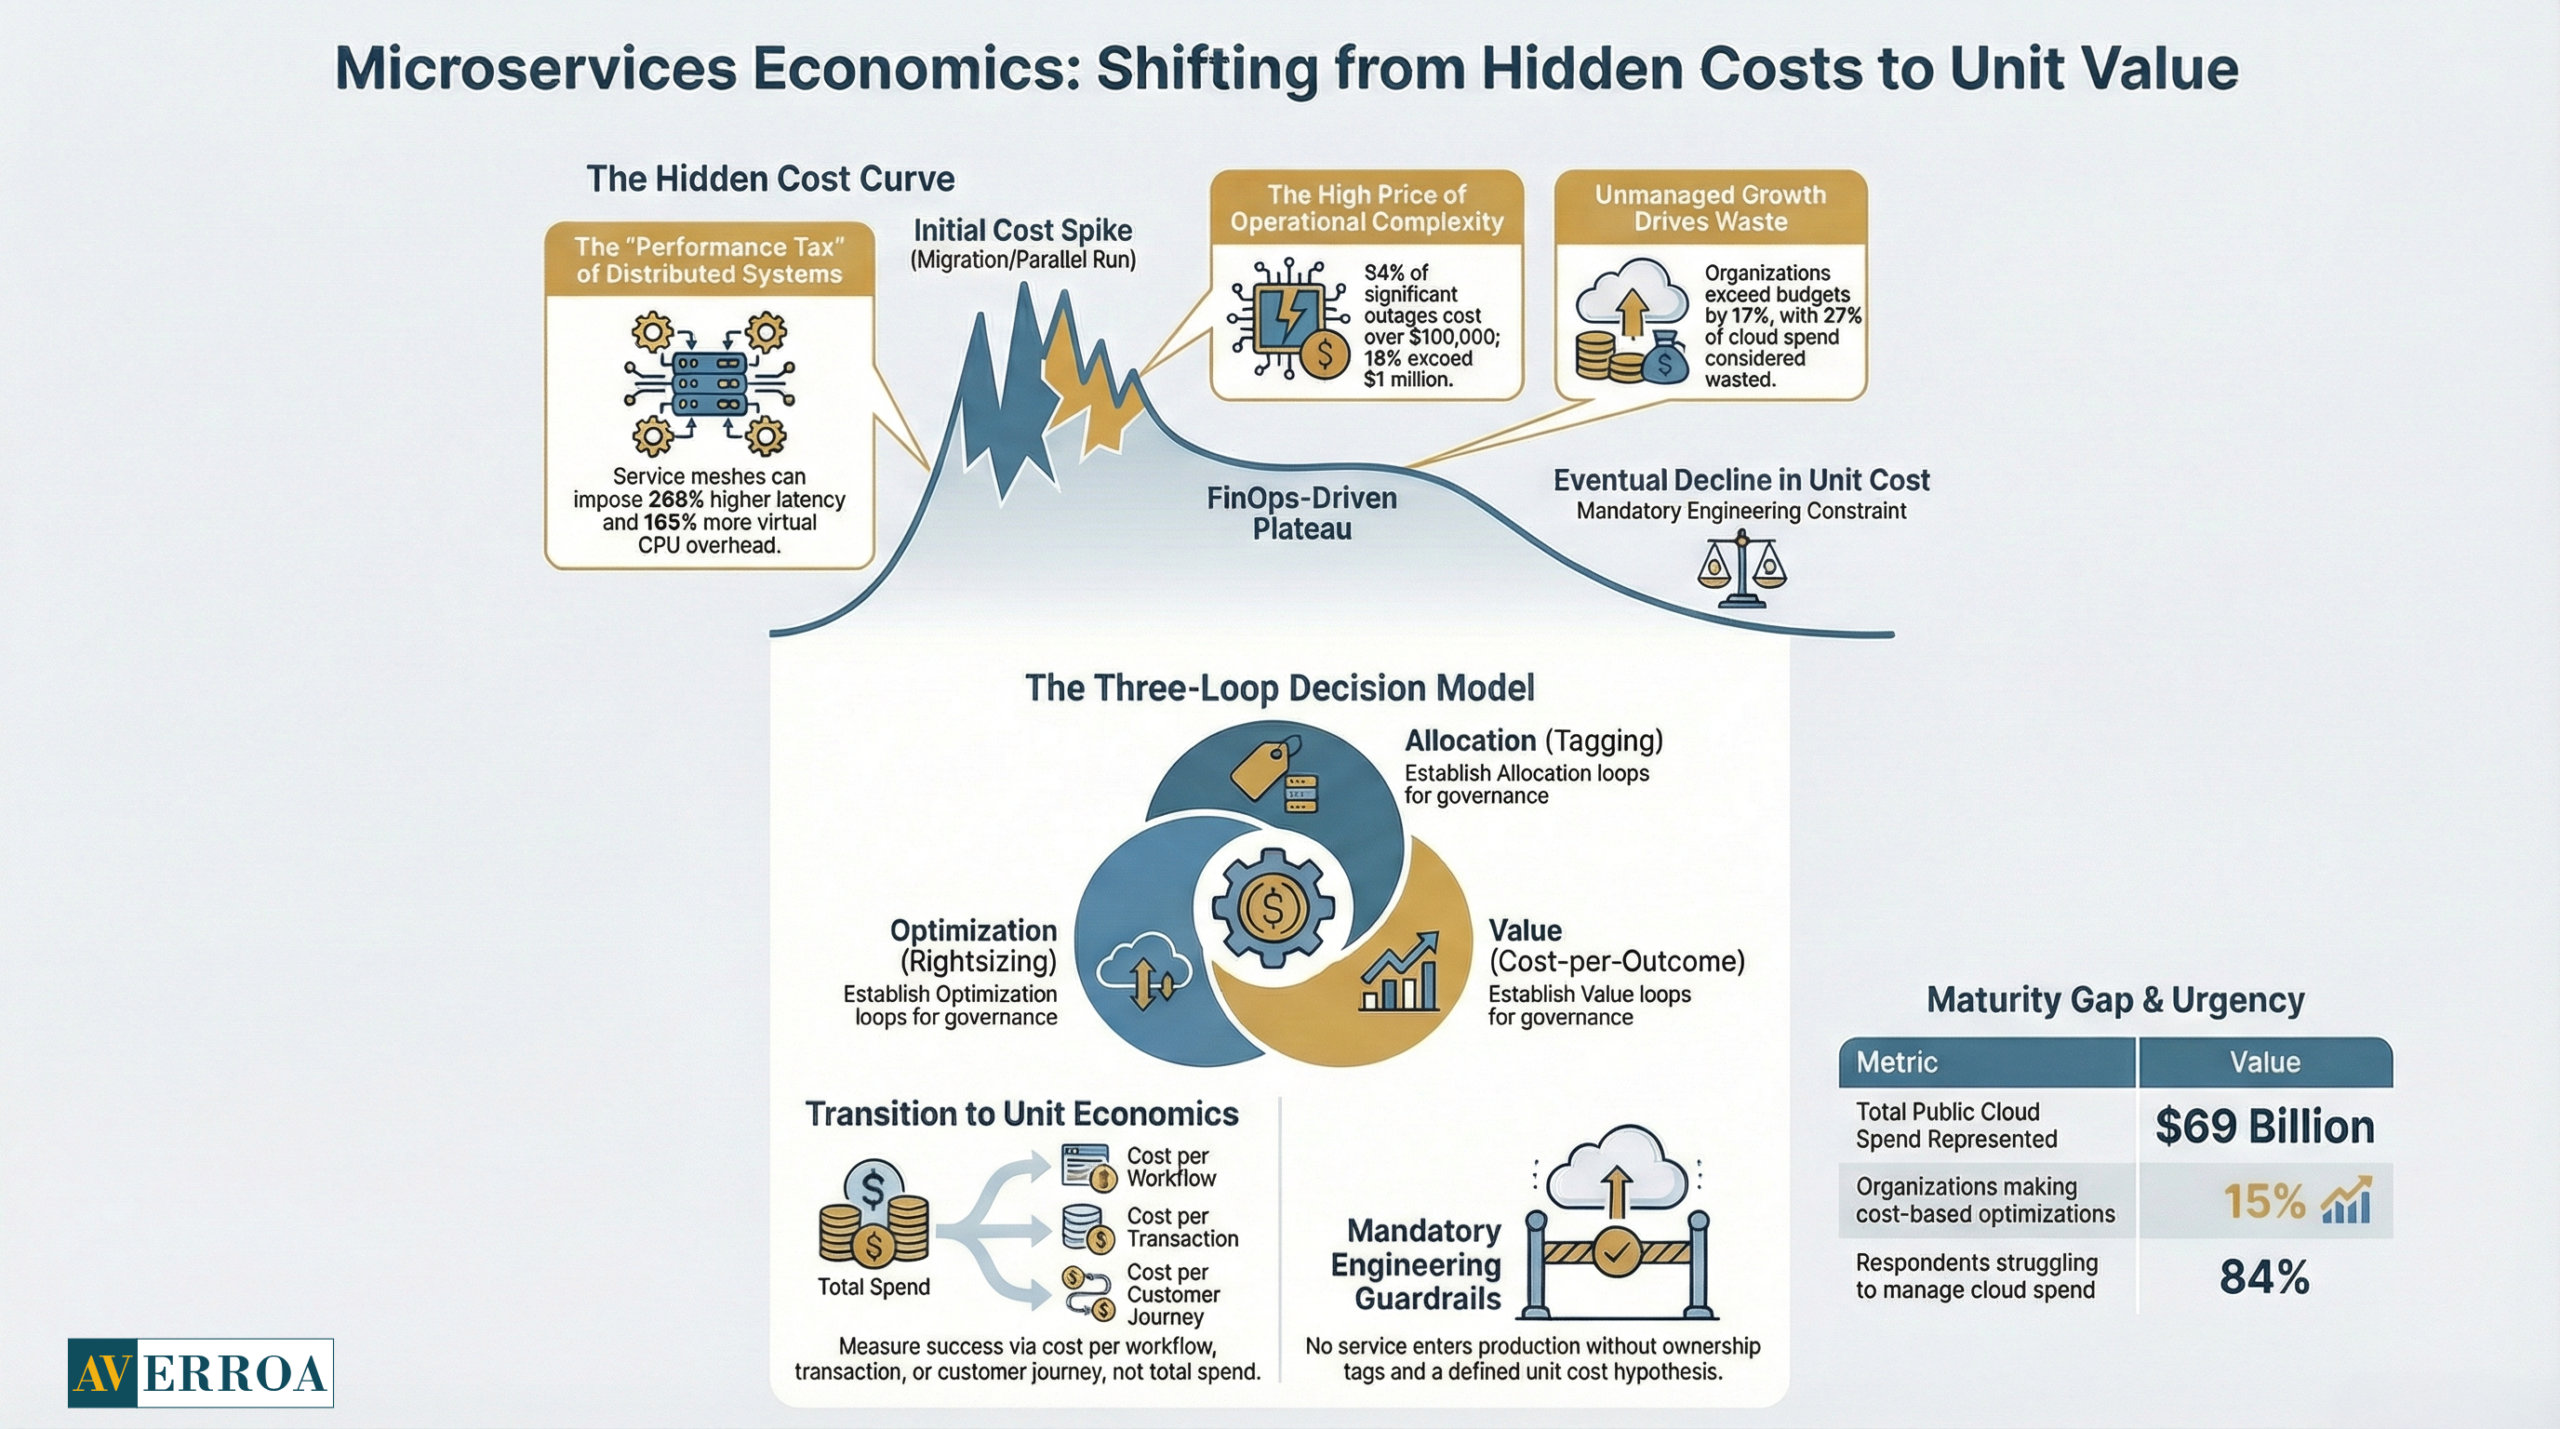
A useful example comes from peer-reviewed systems research on service mesh sidecars. The SoCC 2023 paper “Dissecting Overheads of Service Mesh Sidecars” reports service meshes can impose up to 269% higher latency and require up to 163% more virtual CPU cores in benchmark scenarios, with severity tied to configuration and workload. (Oct to Nov 2023)
You should not generalise those numbers to every environment. You should take the implication seriously: every added hop, proxy, and security feature has a measurable performance and cost profile. If you adopt service meshes, deep telemetry, and zero trust controls, you should plan for the runtime overhead, then validate it in your own workload.
Platform tax, duplicated capabilities, and parallel run
Microservices usually require a shared platform layer, even in organisations that initially resist the idea. You need standard CI/CD, identity, secrets management, routing, and observability. That investment is rational, but it is not free.
Gartner’s cloud trends press release includes a blunt warning: Gartner predicts 25% of organisations will have experienced significant dissatisfaction with cloud adoption by 2028, driven by unrealistic expectations, suboptimal implementation, or uncontrolled costs. (13 May 2025)
This is where myths fail. Many microservice programmes are funded as “cloud migration”, but executed as “replatform plus rebuild”. You run old and new in parallel, you pay for duplicated tooling, and you pay for inconsistent standards through incident load.
People tax, on-call, coordination, and tool sprawl
Microservices increase the number of components that can wake someone up at 2am. That is a real cost, even if it does not appear on the cloud invoice.
Outage economics are a forcing function. Uptime Institute’s Annual Outage Analysis 2024 executive summary reports more than half of respondents, 54%, said their most recent significant outage cost more than $100,000, and 16% said it cost more than $1 million. (March 2024)
A separate but related signal comes from CircleCI’s 2026 delivery analysis: main branch success rates dropped to 70.8%, recovery times rose to 72 minutes, and throughput gains were uneven. (18 Feb 2026) That is a validation and recovery constraint, and it is expensive in a distributed estate.
If you are serious about microservices economics, you price people’s time explicitly. You treat operational toil and coordination as cost drivers, not as “soft issues”.
FinOps for microservices: unit economics as a delivery constraint
FinOps is often misunderstood as cost-cutting. In practice, FinOps is how you run a rational operating model where teams can trade performance, speed, and cost in a controlled way.
Business impact and risk
Microservices without unit economics is governance without visibility. You can only optimise what you can attribute, and many organisations still struggle to attribute spend cleanly. Flexera’s release points to managed service provider use at 60% and FinOps adoption at 59%, signalling that many teams are looking for operational capacity and financial control at the same time. (19 Mar 2025)
The FinOps Foundation’s State of FinOps Report 2025 adds useful scale context: 861 respondents representing about $69B in public cloud spend. (2025) That is a meaningful dataset, and it signals how central cost governance has become.
What changes in operating model and governance
A practical FinOps operating model for microservices has three decision loops:
- Allocation loop
Tagging, ownership, and showback at team and service level. Without this, microservices economics becomes invisible. - Optimisation loop
Rightsizing, autoscaling hygiene, storage lifecycle, and workload scheduling. This is where savings are found, but only when you can measure. - Value loop
Cost per outcome, such as cost per workflow completed, cost per transaction, cost per onboarding. This is where executives can judge whether spend is justified.
A useful and slightly uncomfortable stat from the State of FinOps Report 2025 page is that only 15% of global practices are making optimisations based on cost. (2025) I interpret this as a maturity signal: many teams are still building visibility and governance muscles, not yet running continuous optimisation.
Architecture and integration implications
To support microservices economics, architects should treat these as non-negotiables:
- clear ownership per service and per customer journey
- telemetry designed for cost attribution, not just debugging
- an explicit position on data duplication, since storage and processing are now repeated across services
- a bias for simplicity, because every additional integration point increases run cost and failure probability.
Implementation approach: engineering the cost curve you can govern
This is the part that should feel conservative. It is how you avoid turning microservices into a permanent cost escalation story.
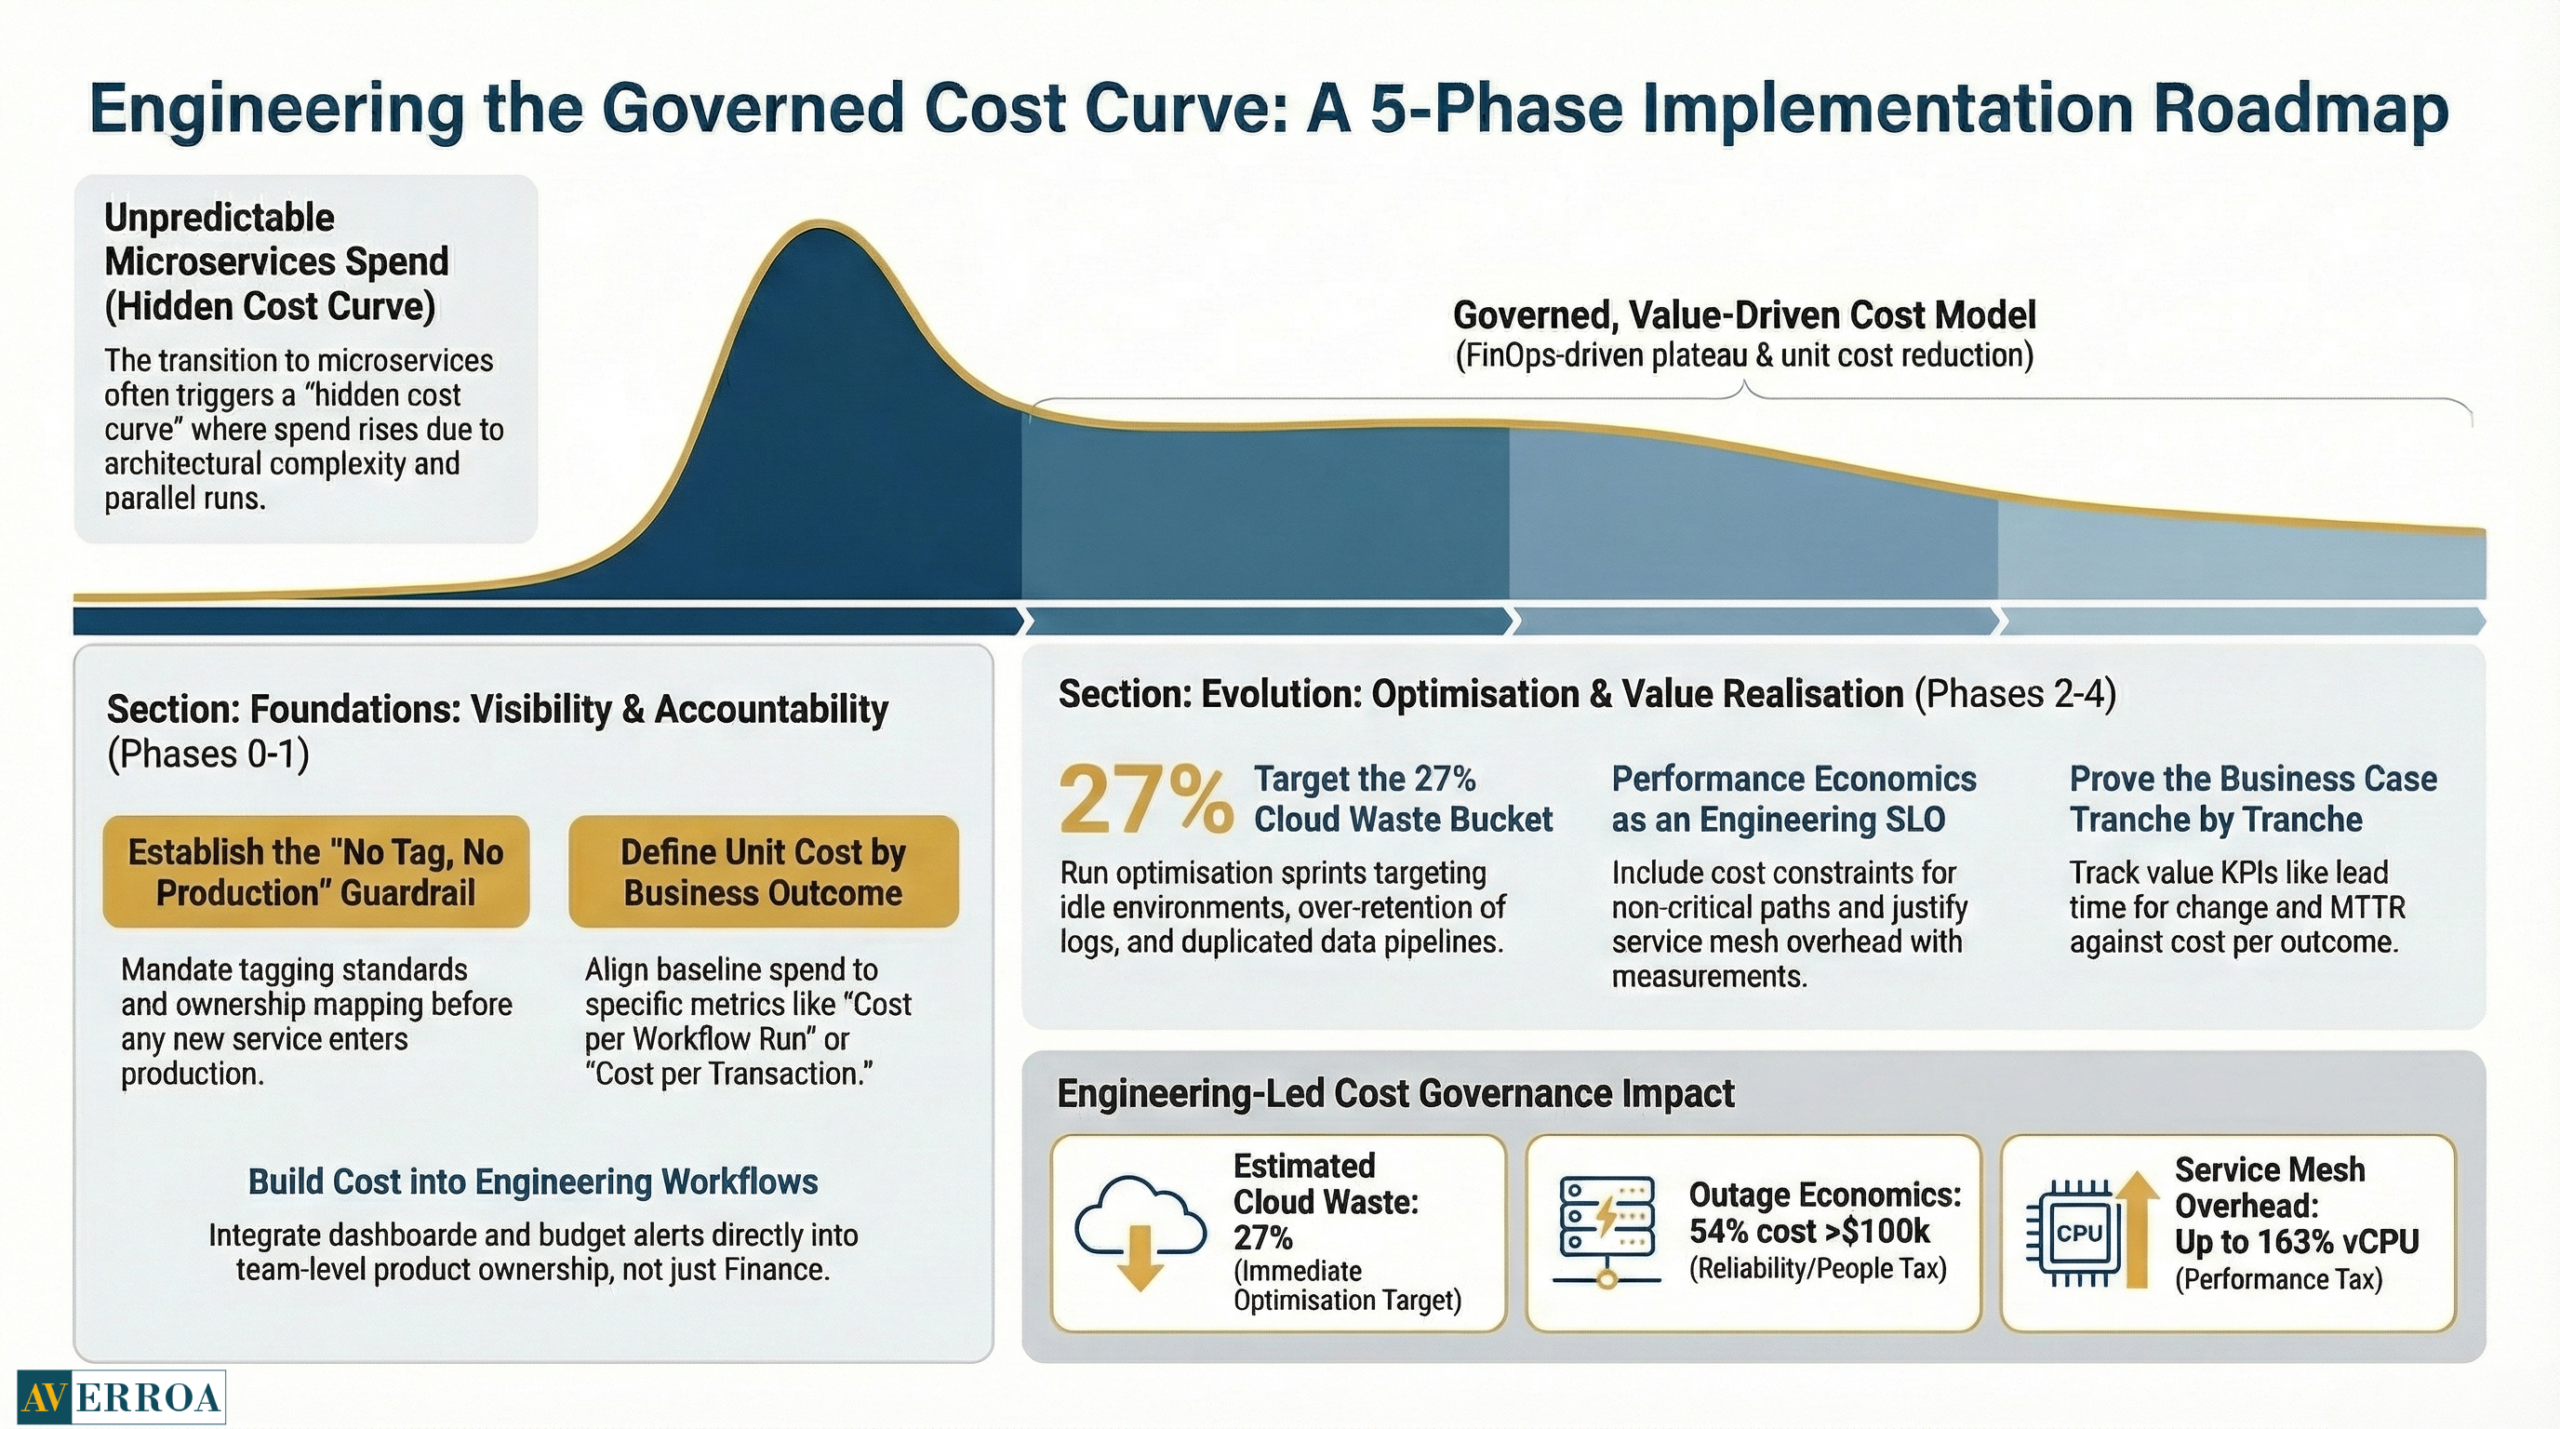
Phase 0: baseline, tag, and define “unit cost”
Deliverables:
- tagging standards and ownership mapping for all environments
- a baseline invoice breakdown by product, environment, and team
- a first unit cost definition aligned to business outcomes, for example cost per workflow run
Governance guardrail:
- no new service in production without tags, an owner, and a unit cost hypothesis
Typical failure mode:
- Showback arrives after the service footprint has multiplied, and the only lever left is blunt cost-cutting.
Phase 1: build cost visibility into engineering workflows
Deliverables:
- dashboards for cost by service, environment, and journey
- budget alerts aligned to product owners, not to a central inbox
- a “cost review” step in architecture decisions, lightweight but mandatory
KPIs:
- percentage of spend attributed to a service owner
- variance to the budget and forecast accuracy
- cost per workflow run trend
Phase 2: run optimisation sprints that target the top cost drivers
Optimisation targets that repeatedly pay back:
- idle and oversized environments
- over retention of logs and traces
- duplicated data pipelines and unnecessary replication
- inefficient autoscaling boundaries
A concrete anchor: Flexera’s key findings mention 27% of cloud spend continues to be wasted. (2025) You do not need to recover all of it. You need a repeatable mechanism to recover a meaningful portion without slowing delivery.
Phase 3: performance economics, reduce latency, reduce runtime overhead
This is where engineering and FinOps converge.
Guardrails:
- SLOs include cost constraints for non-critical paths
- Service mesh and sidecar features are justified with measurements, not preferences
- load testing includes cost and latency outcomes
Why this matters: the service mesh paper shows overhead can be very high in certain configurations. (SoCC 2023) You should decide whether the security and control benefits are worth the performance and CPU overhead in your environment, then tune.
Phase 4: value realisation, prove the business case tranche by tranche
This is where microservices economics becomes board ready.
Value KPIs:
- lead time for change and change failure rate
- MTTR and customer-impacting incident rate
- cost per outcome, for example, cost per onboarding, cost per order, cost per workflow step
- revenue or cycle time uplift attributable to the migrated capability
Anonymised example, EU:
An EU insurer decomposed a policy servicing monolith into about 30 services. Cloud spend rose sharply, driven by parallel run, duplicated test environments, and high telemetry retention. After introducing showback, environment lifecycle policies, and tighter retention on high-volume logs, the bill stabilised. The executive win was not “microservices”. The win was a measurable reduction in change lead time for policy updates, with unit cost per transaction trending down over two quarters.
Anonymised example, MENA:
A MENA logistics platform carved out quoting and pricing into independent services to handle seasonal spikes. Costs increased initially due to new platform components and observability. They recovered economics by implementing autoscaling and workload scheduling tied to demand windows, and by tracking cost per quote and cost per booking as the executive KPI. The outcome was higher peak resilience with controlled spend, which is the actual promise of microservices economics.
Actionable Takeaways
- Treat microservices economics as a programme stream, not as a finance afterthought.
- Assume the cost curve rises first, because you will run parallel systems and duplicate capabilities. Plan for it.
- Implement FinOps as an operating model, with engineering, finance, and business accountability. (FinOps definition updated Jan 2025)
- Make unit economics visible, cost per workflow run, cost per transaction, cost per customer journey, and assign owners.
- Price performance overhead explicitly. Sidecars, meshes, and telemetry have measurable runtime costs. (SoCC 2023)
- Use outage economics to justify reliability work, because outages routinely exceed $100,000 and sometimes exceed $1 million. (March 2024)
- Track delivery recovery and validation constraints, because they drive hidden people costs in distributed estates. (CircleCI, Feb 2026)
- Optimise the big waste buckets first, environments, telemetry retention, and duplicated data pipelines. (Flexera, 2025)
- If leadership cannot see the cost by the service owner, pause service proliferation and fix attribution first.
If you are modernising workflow-heavy enterprise systems and want microservices benefits with controlled spend, start with Enterprise Custom Development and build a cost and value baseline before scaling service count.
References
- Flexera 2025 cloud spend findings (Mar 2025) → https://www.flexera.com/about-us/press-center/new-flexera-report-finds-84-percent-of-organizations-struggle-to-manage-cloud-spend
- FinOps Foundation State of FinOps Report 2025 → https://data.finops.org/2025-report/
- FinOps definition (updated Jan 2025) → https://www.finops.org/introduction/what-is-finops/
- Gartner cloud trends and dissatisfaction prediction (May 2025) → https://www.gartner.com/en/newsroom/press-releases/2025-05-13-gartner-identifies-top-trends-shaping-the-future-of-cloud
- Uptime Institute outage cost key findings (Mar 2024, PDF) → https://datacenter.uptimeinstitute.com/rs/711-RIA-145/images/2024.Resiliency.Survey.ExecSum.pdf
- CircleCI 2026 delivery takeaways (Feb 2026) → https://circleci.com/blog/five-takeaways-2026-software-delivery-report/
- SoCC 2023 service mesh overhead paper (PDF) → https://foci.uw.edu/papers/socc23-meshinsight.pdf
The Hidden Cost Curve: Performance, Cloud Spend, and Microservices Economics
Microservices economics is where many enterprise migrations either earn trust or lose it. The architecture may be “modern”, but the bill, the latency, and the on call load often move in the wrong direction first. That is not a surprise. It is the default outcome when you increase the number of deployable units, duplicate data, add telemetry, and run legacy and new in parallel.
The timing is unforgiving. Flexera’s 2025 State of the Cloud press release found 84% of respondents say managing cloud spend is the top cloud challenge, and cloud spend is expected to rise 28% in the coming year. (19 Mar 2025) That same release notes budgets already exceed limits by 17%, and 33% of organisations spend more than $12M annually on public cloud. (19 Mar 2025)
At the same time, the FinOps Foundation’s State of FinOps Report 2025 reflects an uncomfortable maturity gap. It reports 861 respondents representing about $69B in public cloud spend, yet only 15% of practices are making optimisations based on cost. (2025)
So the decision is not whether microservices are “better”. The decision is whether you can manage the cost curve deliberately, using FinOps thinking and engineering guardrails, instead of discovering your new operating model through surprise invoices and production incidents.
Microservices economics: why costs rise before they fall
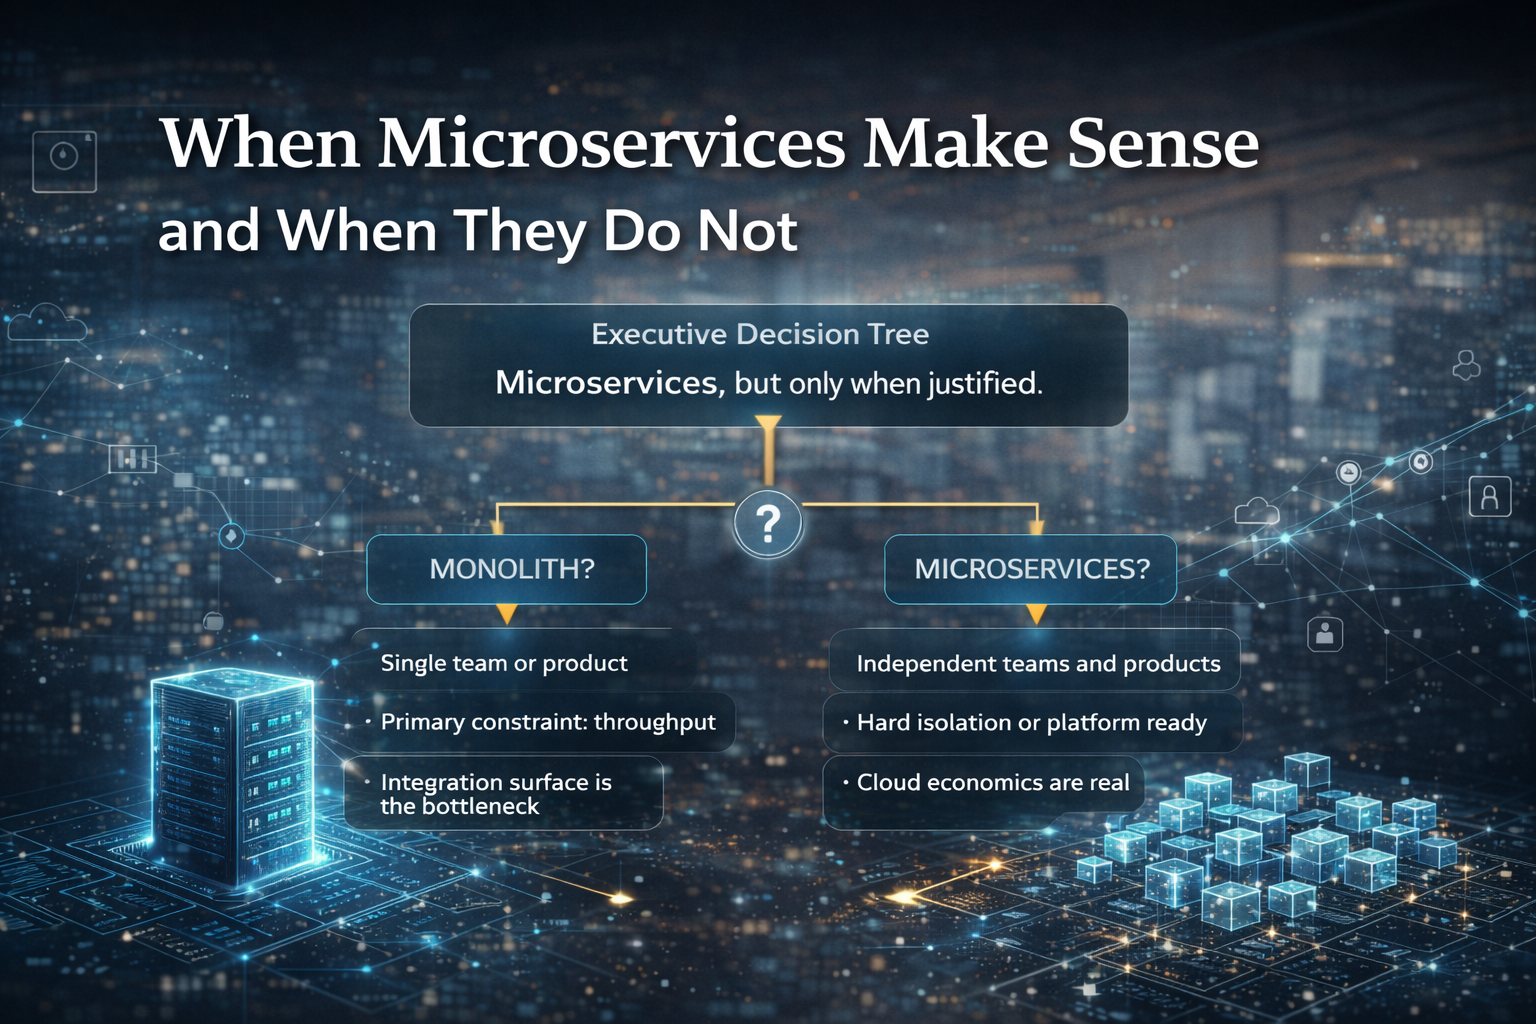
A strong opinion, based on repeated delivery patterns: microservices are not cheaper by default. They are a premium operating model. You pay for optionality, independent scaling, and faster change, and you only recover that investment if you control execution.
Business impact and risk
Cost is not just a finance topic. It is an operational risk indicator. When spend rises without clear value, teams cut corners, tooling sprawl grows, and production risk increases.
The cloud spend signals are already clear. Flexera reports budgets exceeding limits by 17% and cloud spend expected to increase 28%. (19 Mar 2025) In the same State of the Cloud key findings page, Flexera states organisations are focusing on cost optimisation to recapture 27% of cloud spend that continues to be wasted. (2025) If you increase architectural complexity without a disciplined value realisation plan, you often increase that waste surface.
What changes in the operating model and governance
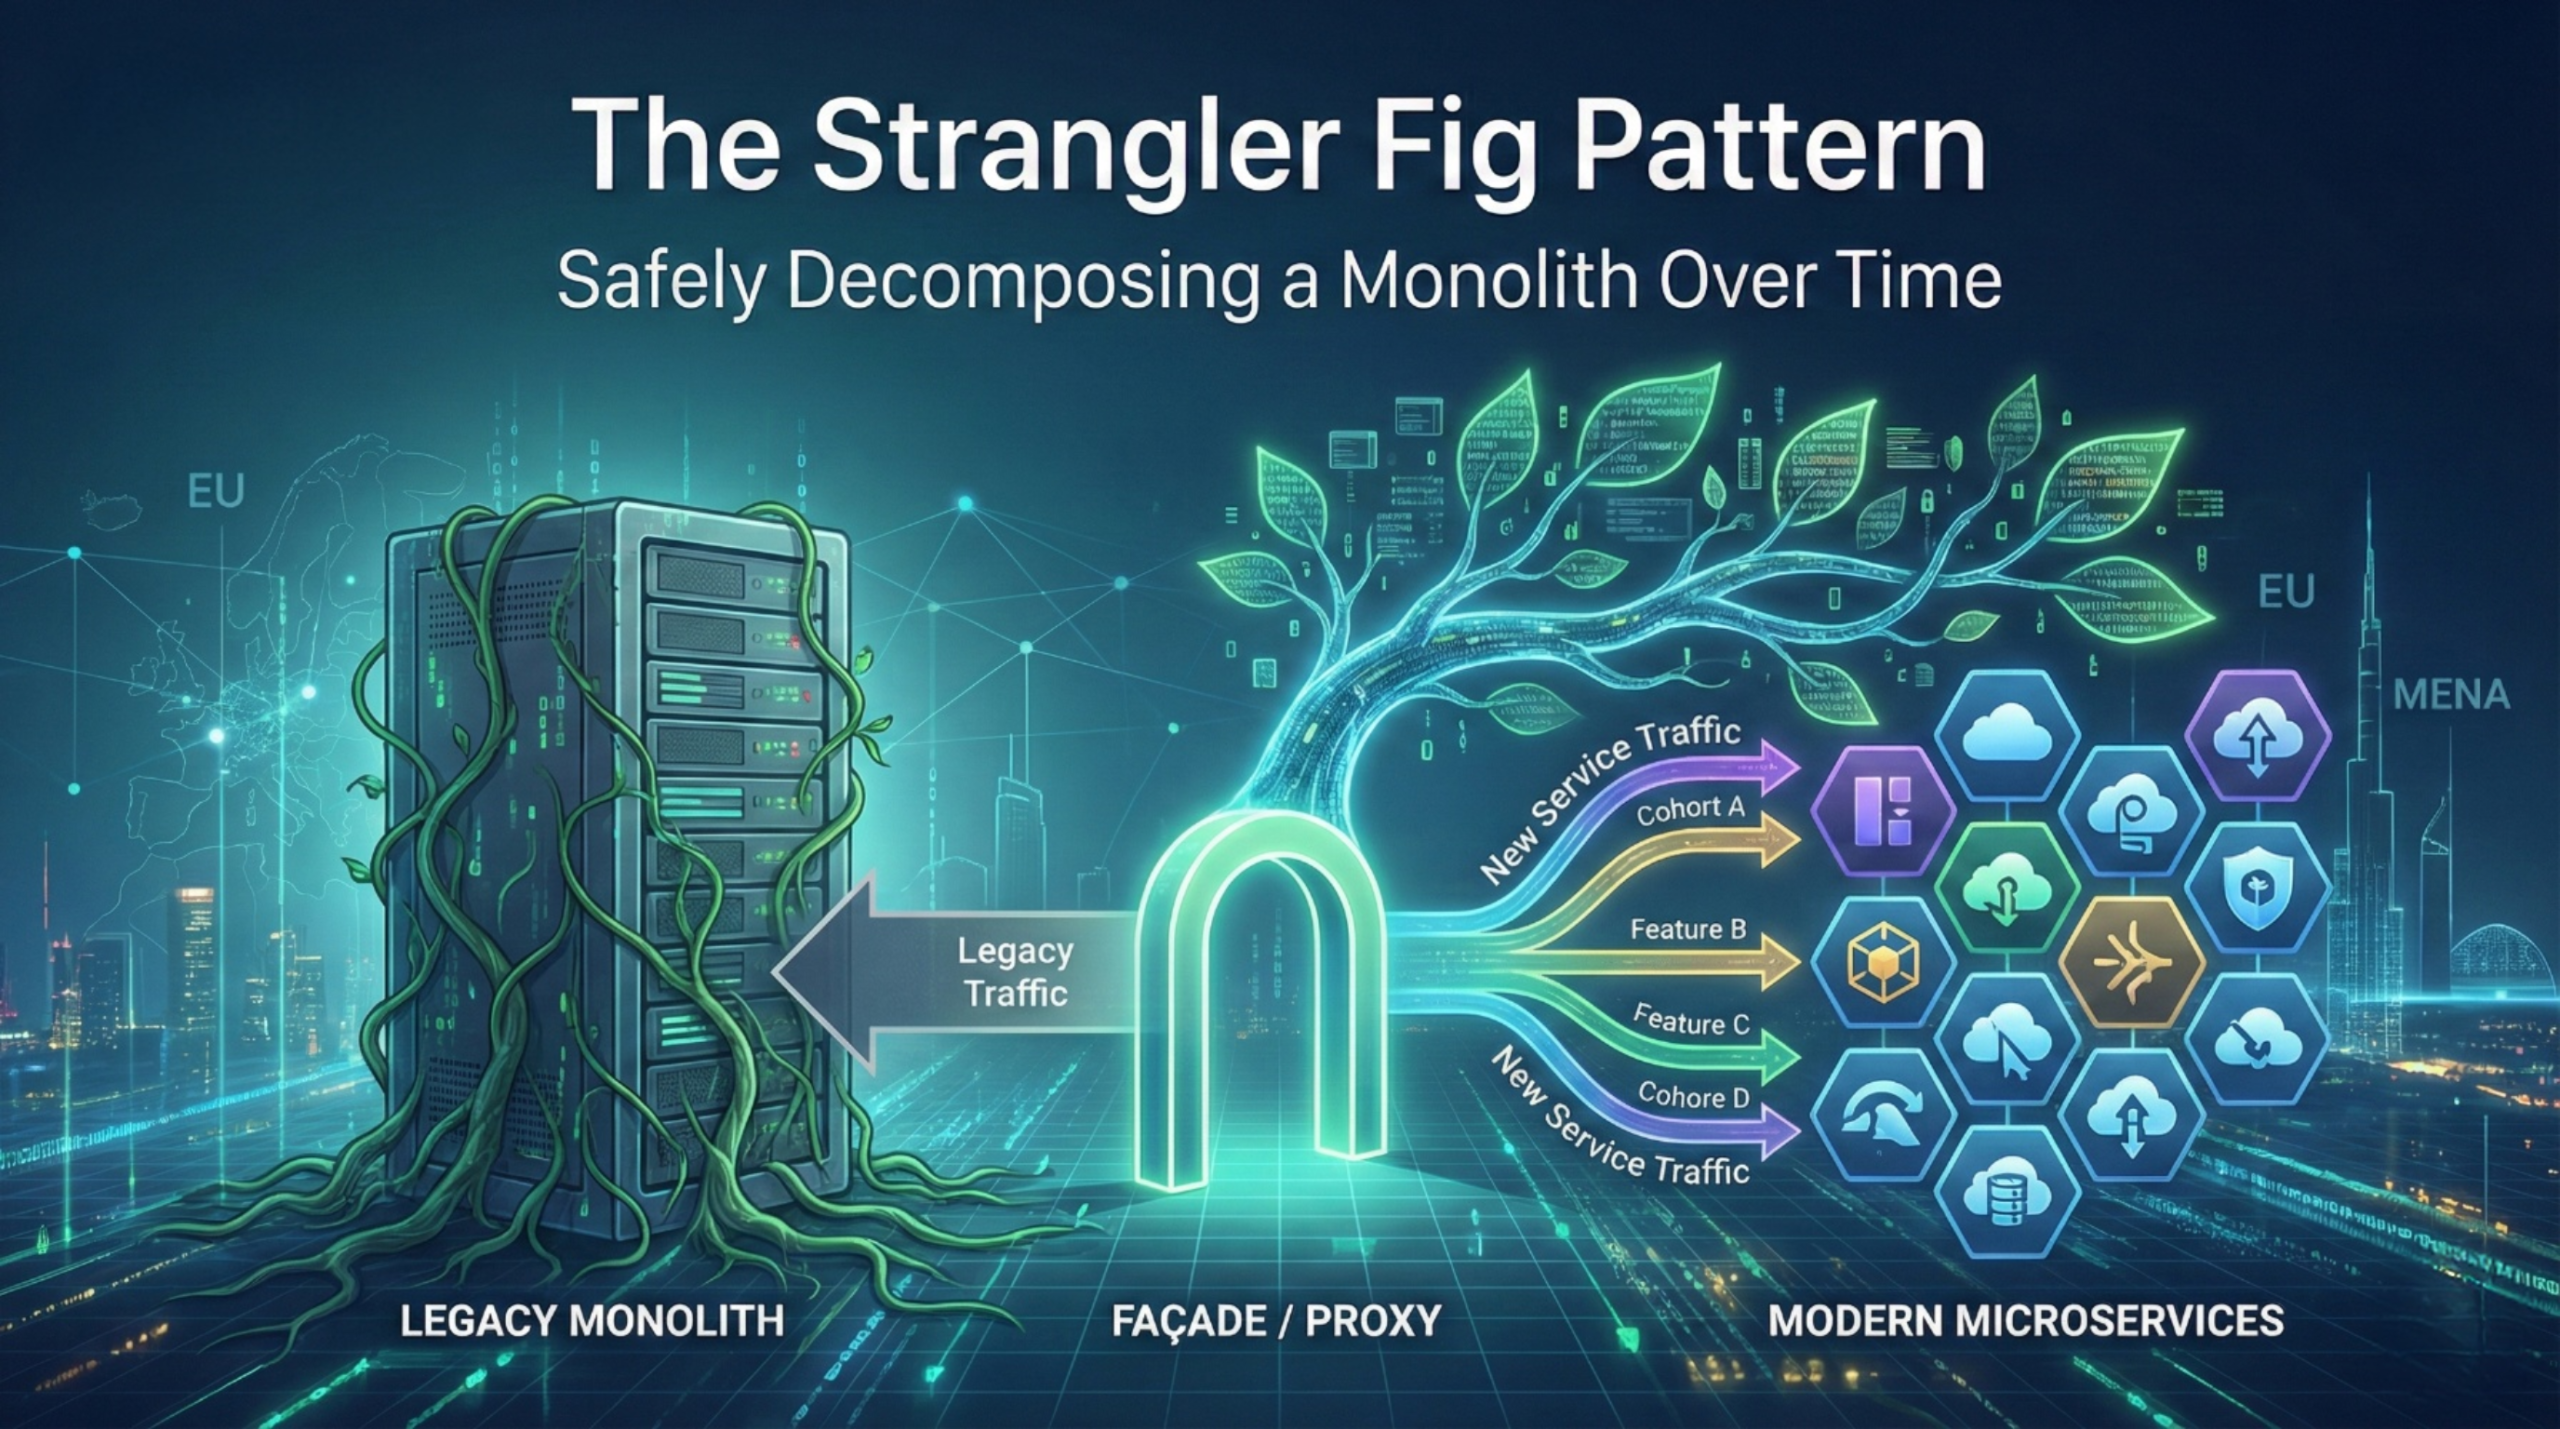
Microservices economics changes who needs to care about cost and when. In a monolith, cost can be treated as a platform line item. In microservices, cost needs to be owned at service and journey level, by the teams making architecture choices.
The FinOps Foundation’s definition captures the operating model shift: FinOps is an operational framework and cultural practice that maximises business value, enables timely data driven decisions, and creates financial accountability through collaboration between engineering, finance, and business teams. (Updated Jan 2025)
If that collaboration does not exist, you get a governance gap. Engineering optimises for speed. Finance reacts after the invoice arrives. The cost curve becomes a surprise, not a managed programme.
Architecture and integration implications
Microservices increase cost drivers through:
- more runtime components, including gateways, service discovery, policy, telemetry pipelines
- more environments, because teams need independence and safe releases
- more cross service calls, which increases compute and latency overhead
- more data movement and duplication, which increases storage and processing costs
You can still win on unit economics, but only if you set up cost attribution and constraints early.
Where the money goes: performance tax, platform tax, people tax
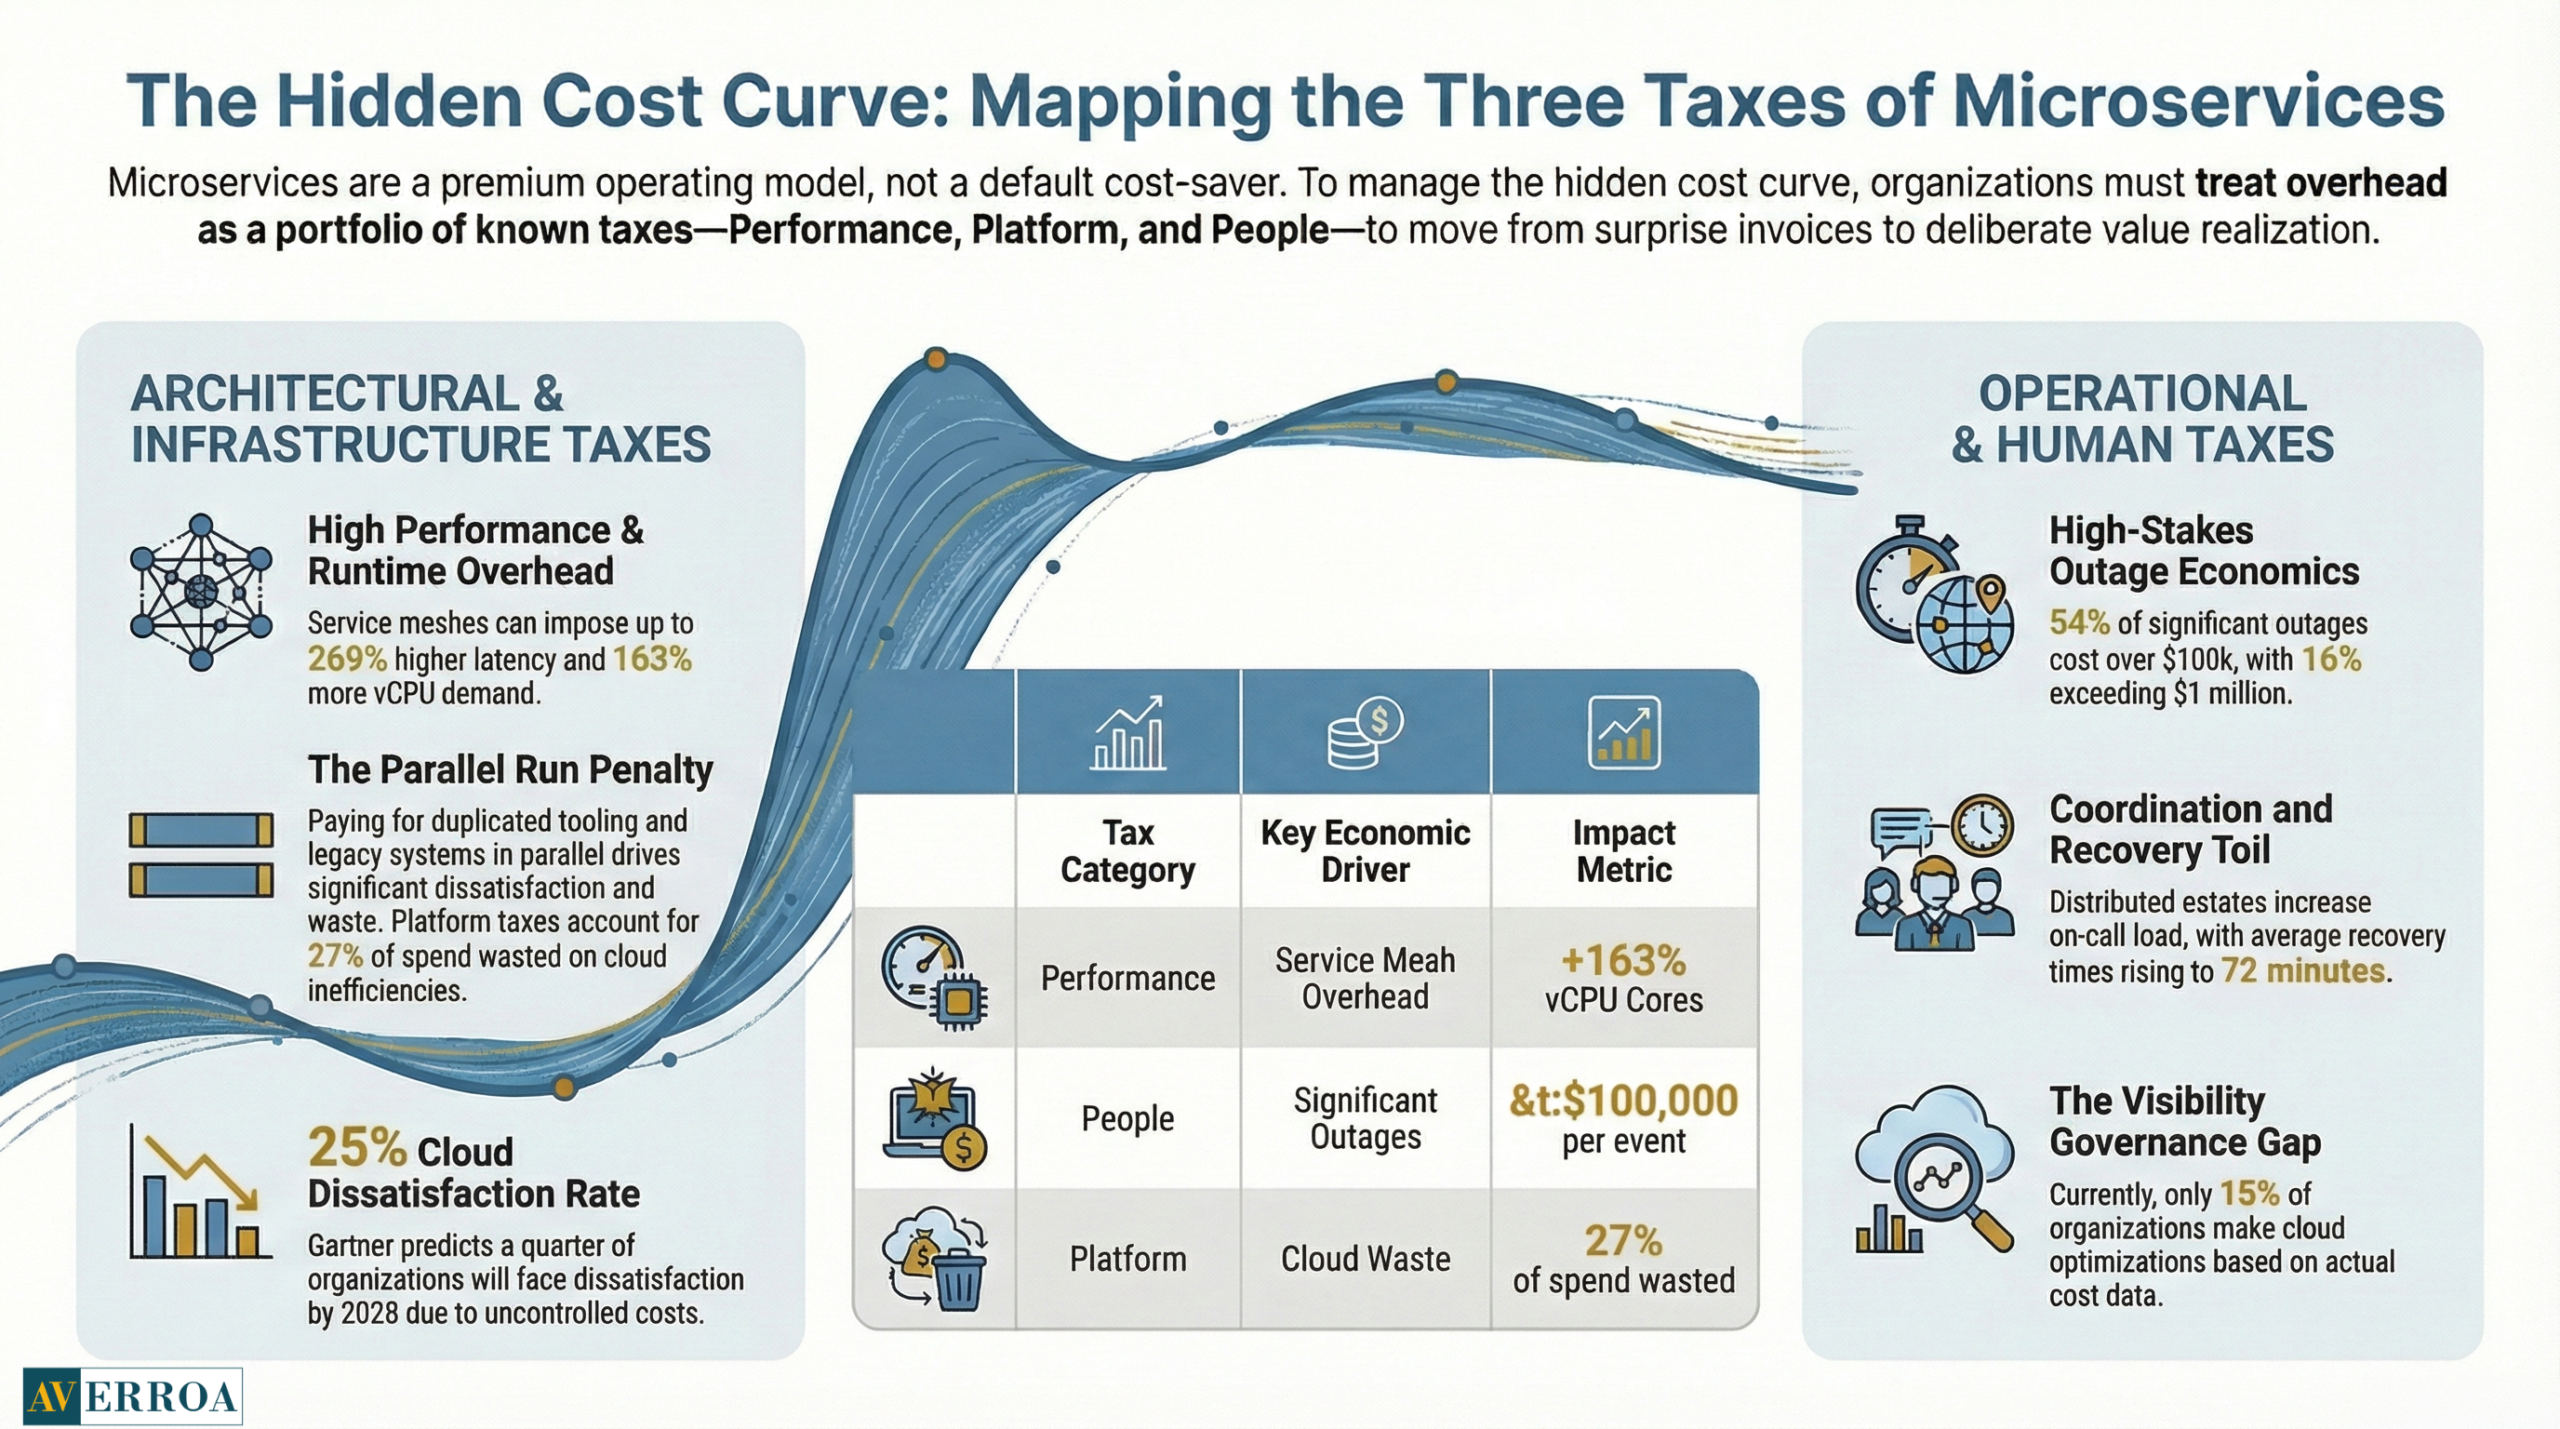
To manage microservices economics, you need a clear view of where costs accumulate. The best programmes treat this as a portfolio of known taxes.
Performance tax, network, sidecars, and the “observability bill”
Distributed systems add overhead. Sometimes it is small. Sometimes it is material.
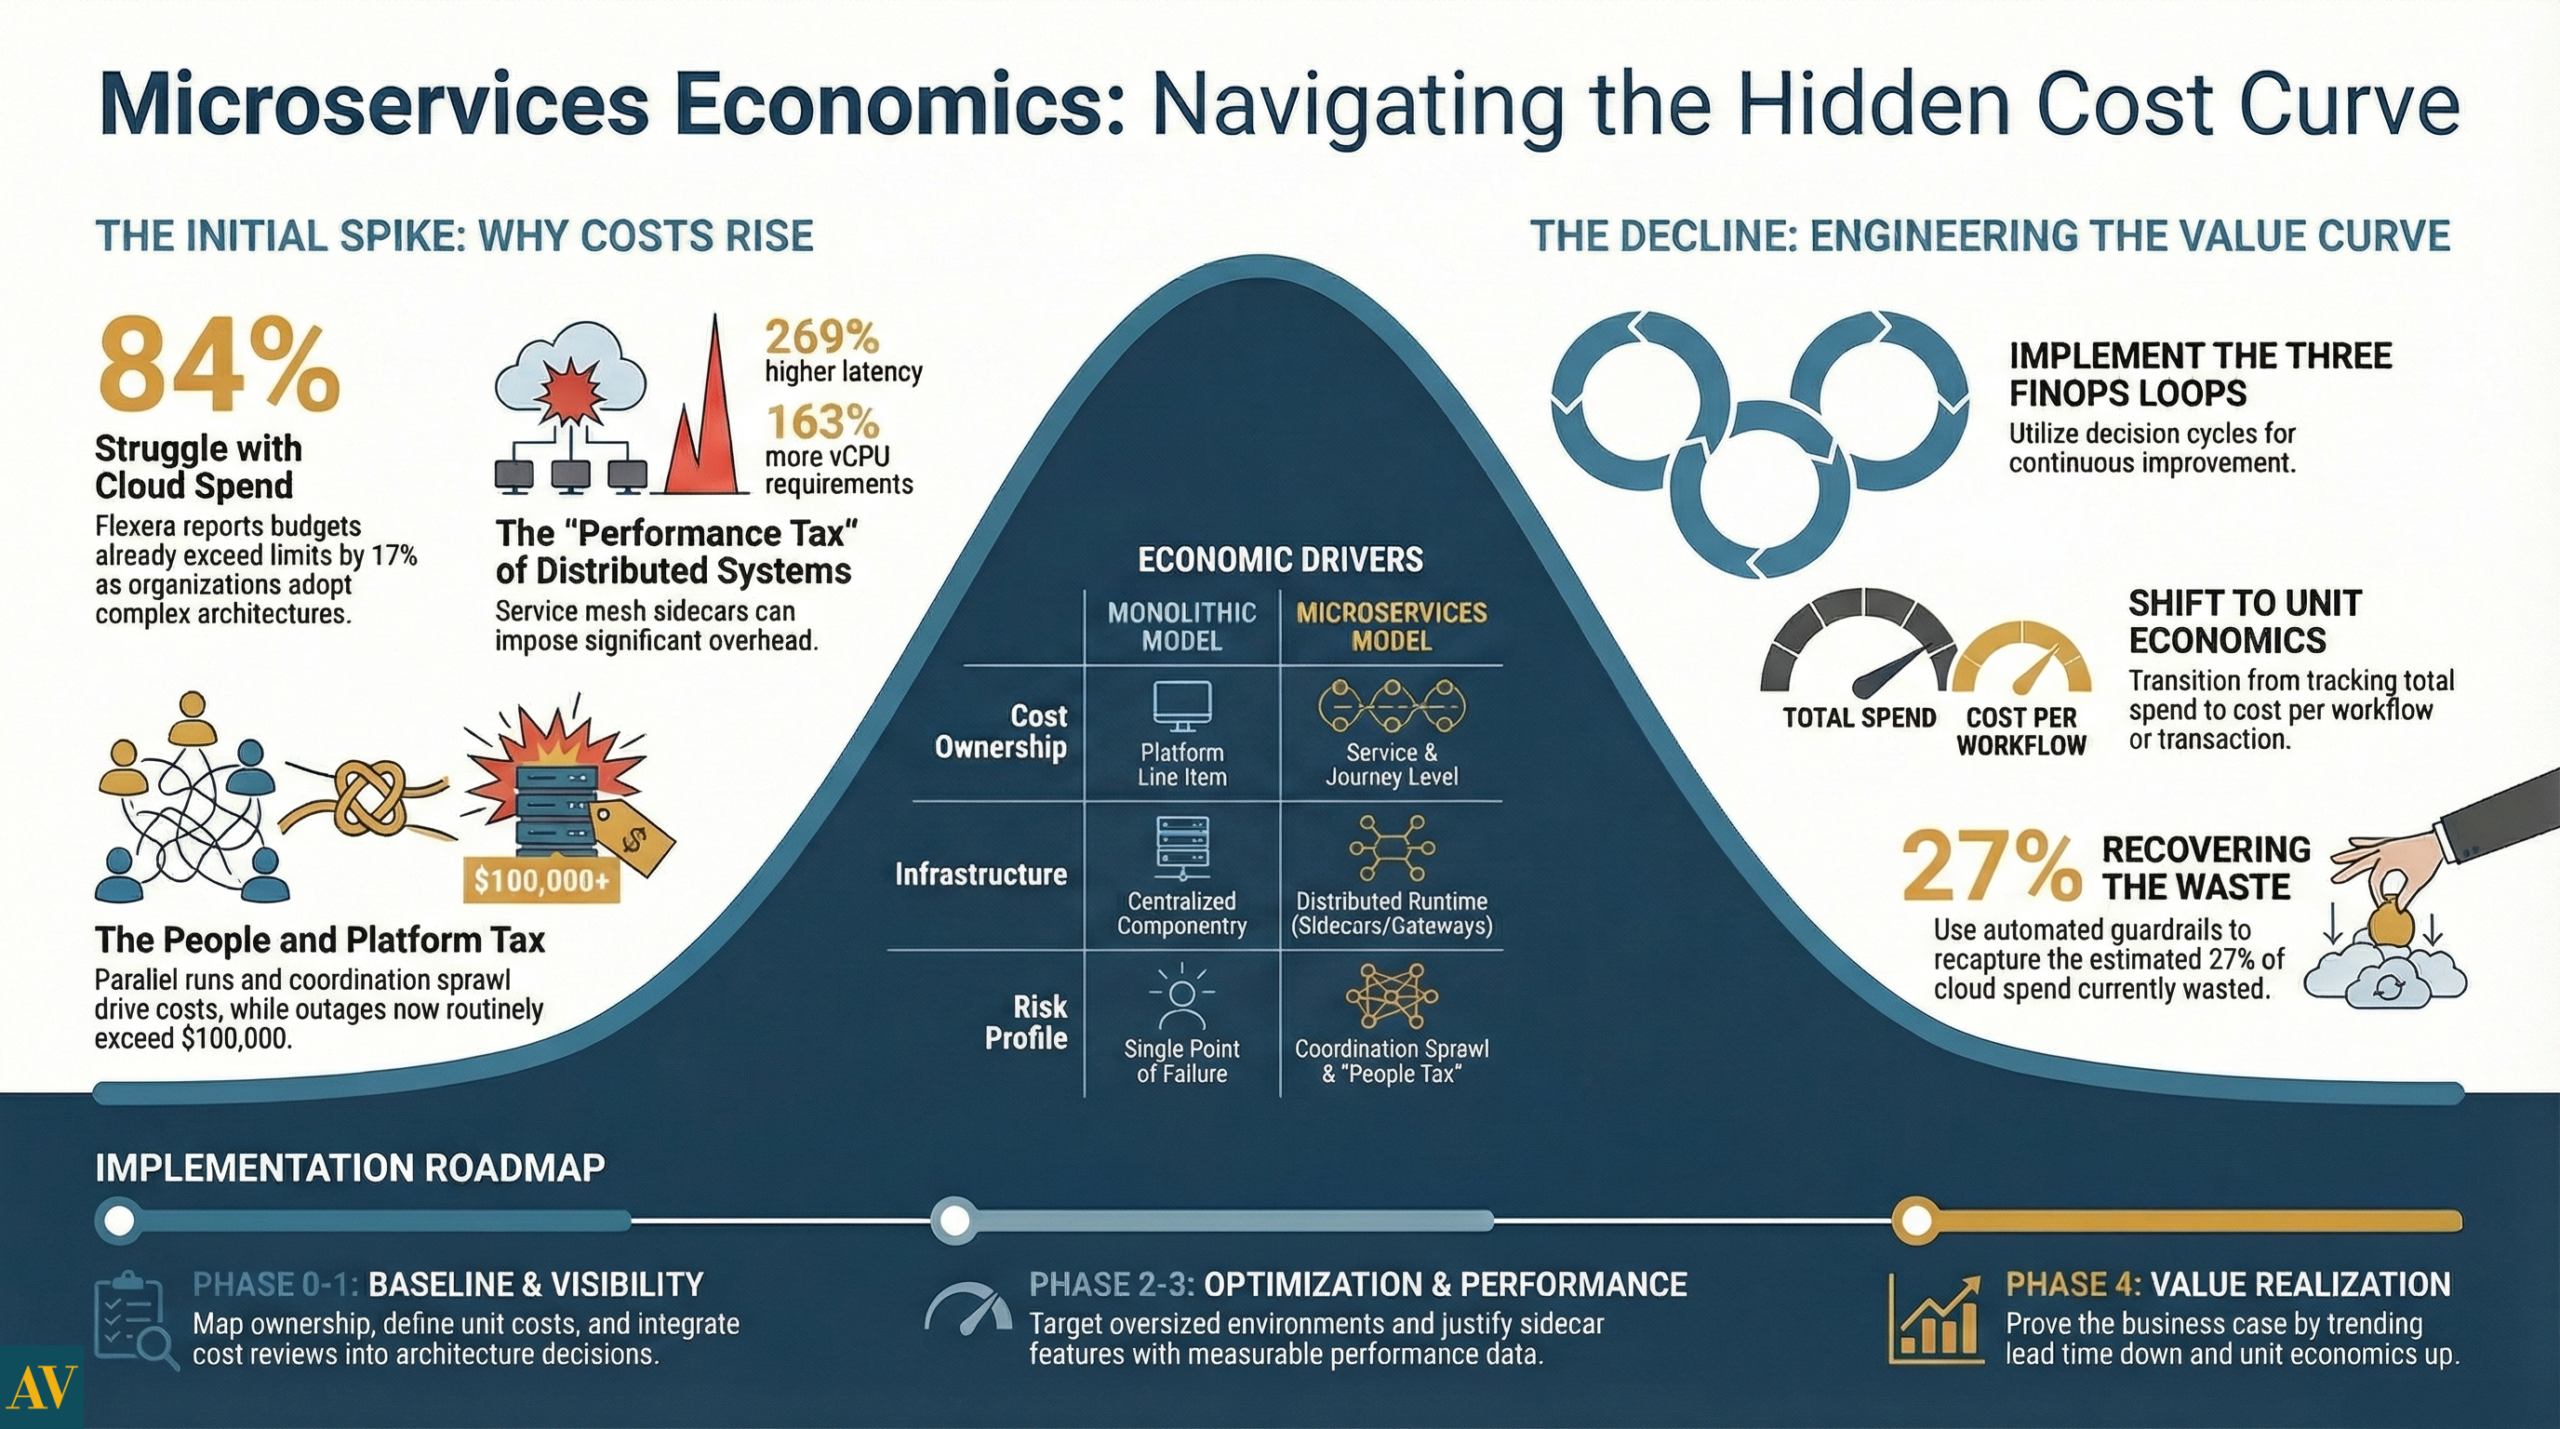
A useful example comes from peer-reviewed systems research on service mesh sidecars. The SoCC 2023 paper “Dissecting Overheads of Service Mesh Sidecars” reports service meshes can impose up to 269% higher latency and require up to 163% more virtual CPU cores in benchmark scenarios, with severity tied to configuration and workload. (Oct to Nov 2023)
You should not generalise those numbers to every environment. You should take the implication seriously: every added hop, proxy, and security feature has a measurable performance and cost profile. If you adopt service meshes, deep telemetry, and zero trust controls, you should plan for the runtime overhead, then validate it in your own workload.
Platform tax, duplicated capabilities, and parallel run
Microservices usually require a shared platform layer, even in organisations that initially resist the idea. You need standard CI/CD, identity, secrets management, routing, and observability. That investment is rational, but it is not free.
Gartner’s cloud trends press release includes a blunt warning: Gartner predicts 25% of organisations will have experienced significant dissatisfaction with cloud adoption by 2028, driven by unrealistic expectations, suboptimal implementation, or uncontrolled costs. (13 May 2025)
This is where myths fail. Many microservice programmes are funded as “cloud migration”, but executed as “replatform plus rebuild”. You run old and new in parallel, you pay for duplicated tooling, and you pay for inconsistent standards through incident load.
People tax, on-call, coordination, and tool sprawl
Microservices increase the number of components that can wake someone up at 2am. That is a real cost, even if it does not appear on the cloud invoice.
Outage economics are a forcing function. Uptime Institute’s Annual Outage Analysis 2024 executive summary reports more than half of respondents, 54%, said their most recent significant outage cost more than $100,000, and 16% said it cost more than $1 million. (March 2024)
A separate but related signal comes from CircleCI’s 2026 delivery analysis: main branch success rates dropped to 70.8%, recovery times rose to 72 minutes, and throughput gains were uneven. (18 Feb 2026) That is a validation and recovery constraint, and it is expensive in a distributed estate.
If you are serious about microservices economics, you price people’s time explicitly. You treat operational toil and coordination as cost drivers, not as “soft issues”.
FinOps for microservices: unit economics as a delivery constraint
FinOps is often misunderstood as cost-cutting. In practice, FinOps is how you run a rational operating model where teams can trade performance, speed, and cost in a controlled way.
Business impact and risk
Microservices without unit economics is governance without visibility. You can only optimise what you can attribute, and many organisations still struggle to attribute spend cleanly. Flexera’s release points to managed service provider use at 60% and FinOps adoption at 59%, signalling that many teams are looking for operational capacity and financial control at the same time. (19 Mar 2025)
The FinOps Foundation’s State of FinOps Report 2025 adds useful scale context: 861 respondents representing about $69B in public cloud spend. (2025) That is a meaningful dataset, and it signals how central cost governance has become.
What changes in operating model and governance
A practical FinOps operating model for microservices has three decision loops:
- Allocation loop
Tagging, ownership, and showback at team and service level. Without this, microservices economics becomes invisible. - Optimisation loop
Rightsizing, autoscaling hygiene, storage lifecycle, and workload scheduling. This is where savings are found, but only when you can measure. - Value loop
Cost per outcome, such as cost per workflow completed, cost per transaction, cost per onboarding. This is where executives can judge whether spend is justified.
A useful and slightly uncomfortable stat from the State of FinOps Report 2025 page is that only 15% of global practices are making optimisations based on cost. (2025) I interpret this as a maturity signal: many teams are still building visibility and governance muscles, not yet running continuous optimisation.
Architecture and integration implications
To support microservices economics, architects should treat these as non-negotiables:
- clear ownership per service and per customer journey
- telemetry designed for cost attribution, not just debugging
- an explicit position on data duplication, since storage and processing are now repeated across services
- a bias for simplicity, because every additional integration point increases run cost and failure probability.
Implementation approach: engineering the cost curve you can govern
This is the part that should feel conservative. It is how you avoid turning microservices into a permanent cost escalation story.
Phase 0: baseline, tag, and define “unit cost”
Deliverables:
- tagging standards and ownership mapping for all environments
- a baseline invoice breakdown by product, environment, and team
- a first unit cost definition aligned to business outcomes, for example cost per workflow run
Governance guardrail:
- no new service in production without tags, an owner, and a unit cost hypothesis
Typical failure mode:
- Showback arrives after the service footprint has multiplied, and the only lever left is blunt cost-cutting.
Phase 1: build cost visibility into engineering workflows
Deliverables:
- dashboards for cost by service, environment, and journey
- budget alerts aligned to product owners, not to a central inbox
- a “cost review” step in architecture decisions, lightweight but mandatory
KPIs:
- percentage of spend attributed to a service owner
- variance to the budget and forecast accuracy
- cost per workflow run trend
Phase 2: run optimisation sprints that target the top cost drivers
Optimisation targets that repeatedly pay back:
- idle and oversized environments
- over retention of logs and traces
- duplicated data pipelines and unnecessary replication
- inefficient autoscaling boundaries
A concrete anchor: Flexera’s key findings mention 27% of cloud spend continues to be wasted. (2025) You do not need to recover all of it. You need a repeatable mechanism to recover a meaningful portion without slowing delivery.
Phase 3: performance economics, reduce latency, reduce runtime overhead
This is where engineering and FinOps converge.
Guardrails:
- SLOs include cost constraints for non-critical paths
- Service mesh and sidecar features are justified with measurements, not preferences
- load testing includes cost and latency outcomes
Why this matters: the service mesh paper shows overhead can be very high in certain configurations. (SoCC 2023) You should decide whether the security and control benefits are worth the performance and CPU overhead in your environment, then tune.
Phase 4: value realisation, prove the business case tranche by tranche
This is where microservices economics becomes board ready.
Value KPIs:
- lead time for change and change failure rate
- MTTR and customer-impacting incident rate
- cost per outcome, for example, cost per onboarding, cost per order, cost per workflow step
- revenue or cycle time uplift attributable to the migrated capability
Anonymised example, EU:
An EU insurer decomposed a policy servicing monolith into about 30 services. Cloud spend rose sharply, driven by parallel run, duplicated test environments, and high telemetry retention. After introducing showback, environment lifecycle policies, and tighter retention on high-volume logs, the bill stabilised. The executive win was not “microservices”. The win was a measurable reduction in change lead time for policy updates, with unit cost per transaction trending down over two quarters.
Anonymised example, MENA:
A MENA logistics platform carved out quoting and pricing into independent services to handle seasonal spikes. Costs increased initially due to new platform components and observability. They recovered economics by implementing autoscaling and workload scheduling tied to demand windows, and by tracking cost per quote and cost per booking as the executive KPI. The outcome was higher peak resilience with controlled spend, which is the actual promise of microservices economics.
Actionable Takeaways
- Treat microservices economics as a programme stream, not as a finance afterthought.
- Assume the cost curve rises first, because you will run parallel systems and duplicate capabilities. Plan for it.
- Implement FinOps as an operating model, with engineering, finance, and business accountability. (FinOps definition updated Jan 2025)
- Make unit economics visible, cost per workflow run, cost per transaction, cost per customer journey, and assign owners.
- Price performance overhead explicitly. Sidecars, meshes, and telemetry have measurable runtime costs. (SoCC 2023)
- Use outage economics to justify reliability work, because outages routinely exceed $100,000 and sometimes exceed $1 million. (March 2024)
- Track delivery recovery and validation constraints, because they drive hidden people costs in distributed estates. (CircleCI, Feb 2026)
- Optimise the big waste buckets first, environments, telemetry retention, and duplicated data pipelines. (Flexera, 2025)
- If leadership cannot see the cost by the service owner, pause service proliferation and fix attribution first.
If you are modernising workflow-heavy enterprise systems and want microservices benefits with controlled spend, start with Enterprise Custom Development and build a cost and value baseline before scaling service count.
References
- Flexera 2025 cloud spend findings (Mar 2025) → https://www.flexera.com/about-us/press-center/new-flexera-report-finds-84-percent-of-organizations-struggle-to-manage-cloud-spend
- FinOps Foundation State of FinOps Report 2025 → https://data.finops.org/2025-report/
- FinOps definition (updated Jan 2025) → https://www.finops.org/introduction/what-is-finops/
- Gartner cloud trends and dissatisfaction prediction (May 2025) → https://www.gartner.com/en/newsroom/press-releases/2025-05-13-gartner-identifies-top-trends-shaping-the-future-of-cloud
- Uptime Institute outage cost key findings (Mar 2024, PDF) → https://datacenter.uptimeinstitute.com/rs/711-RIA-145/images/2024.Resiliency.Survey.ExecSum.pdf
- CircleCI 2026 delivery takeaways (Feb 2026) → https://circleci.com/blog/five-takeaways-2026-software-delivery-report/
- SoCC 2023 service mesh overhead paper (PDF) → https://foci.uw.edu/papers/socc23-meshinsight.pdf
Meet The Author
Meet The Author

Senior software engineer focused on backend systems and Android apps, delivering scalable web/mobile/cloud solutions. Leads technical direction, mentors teams, and ships high-performance services using ASP.NET Core/C#, microservices, and cloud-native infrastructure.
Senior software engineer focused on backend systems and Android apps, delivering scalable web/mobile/cloud solutions. Leads technical direction, mentors teams, and ships high-performance services using ASP.NET Core/C#, microservices, and cloud-native infrastructure.
Averroa Principal
Table of content
- The Hidden Cost Curve: Performance, Cloud Spend, and Microservices Economics
- Microservices economics: why costs rise before they fall
- Where the money goes: performance tax, platform tax, people tax
- FinOps for microservices: unit economics as a delivery constraint
- Implementation approach: engineering the cost curve you can govern
- Phase 0: baseline, tag, and define “unit cost”
- Phase 1: build cost visibility into engineering workflows
- Phase 2: run optimisation sprints that target the top cost drivers
- Phase 3: performance economics, reduce latency, reduce runtime overhead
- Phase 4: value realisation, prove the business case tranche by tranche
- Anonymised example, EU:
- Anonymised example, MENA:
- Actionable Takeaways
- References